# LaraBug documentation
> Error tracking for Laravel and JavaScript applications: exceptions, slow requests, queries, queues, scheduled tasks and dependency vulnerabilities, each with the request context behind it.
Every documentation page, in full. The pages are at https://v4.larabug.com/docs.
---
Source: https://v4.larabug.com/docs/general/welcome.md
# Getting started
These pages cover the two clients, what each kind of telemetry records, what opens an issue, and the integrations. This one gets a Laravel application reporting in a few minutes; the tree on the left has the rest.
## Create an application
An application is the thing an event is reported to. It holds its own keys, its own settings and its own history.
1. **Sign in and open Applications.** A free account is enough; [create one](/register) if you have none.
2. **Create a new application.** Give it a name and pick the environments it runs in.
3. **Copy its keys.** The application's page has the two keys and the DSN that combines them. [Applications and keys](/docs/general/projects-and-keys) says what each is for and how to rotate one.
## Install the Laravel client
```bash
composer require larabug/larabug
```
Add the keys to `.env`. There is nothing to register and no log channel to add.
```env .env
LB_DSN=https://ingest-key:project-key@www.larabug.com/api/log
```
[Installation](/docs/laravel/installation) has the supported versions, and [Configuration](/docs/laravel/configuration) every option in `config/larabug.php`.
## Send a test event
```bash
php artisan larabug:test
```
The command builds a test exception and runs it through the whole pipeline: the environment check, the deduplication window, the filters, the HTTP call. A matching issue appears in your dashboard within a few seconds.
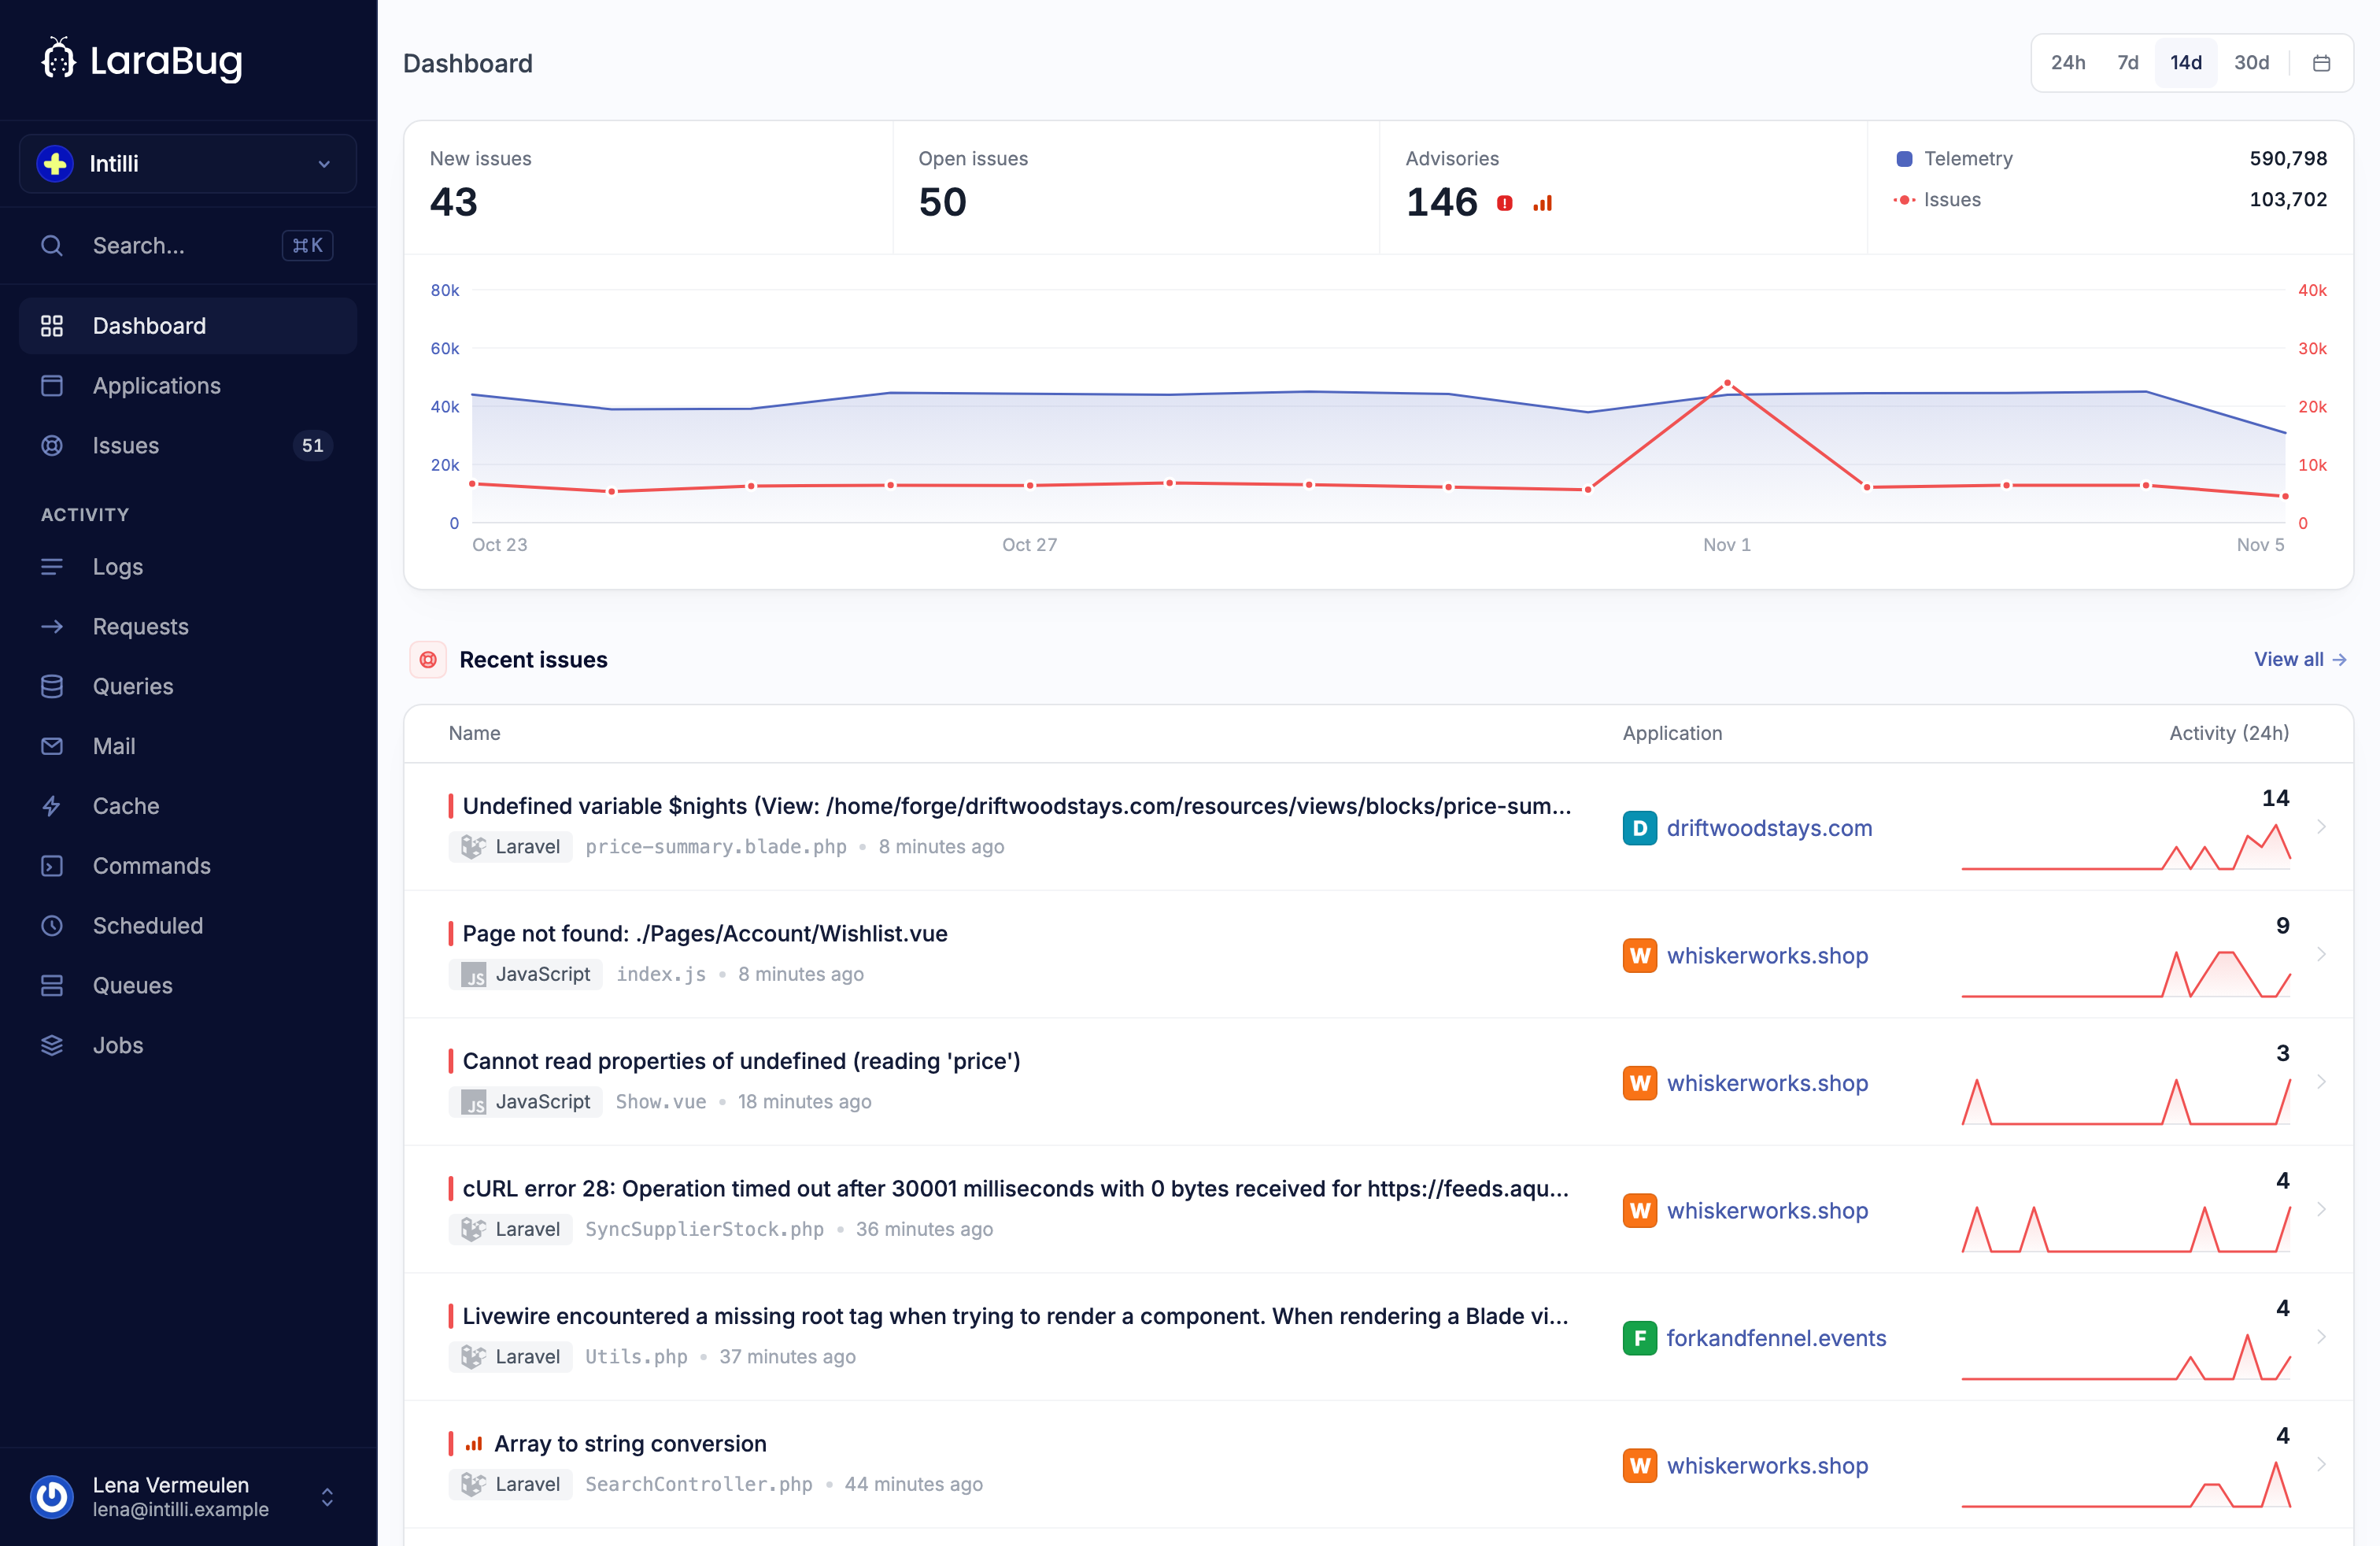
If nothing arrives, [Troubleshooting](/docs/laravel/troubleshooting) starts with the four things that cause almost all of it.
## Add the browser client
The server package does not see what breaks in the browser. One of the browser packages does, and reports it into the same application, mapped back to your source.
```bash
npm install @larabug/browser
```
The [JavaScript installation](/docs/javascript/installation) has the React, Vue 3 and Inertia packages and the `init()` call.
## Switch on telemetry
Out of the box the client reports exceptions, queue jobs and the vulnerable packages in `composer.lock`. Requests, queries, logs, commands and scheduled tasks are off until you turn them on, in `.env` and on the application in the panel, because each costs your application something. [What LaraBug records](/docs/telemetry/overview) has the switches and what each kind costs; [What opens an issue](/docs/issues/overview) has what the panel raises from them.
## Where to go next
* [How LaraBug works](/docs/general/how-larabug-works): applications, events, issues and retention, the four words the rest of the pages use.
* [Applications and keys](/docs/general/projects-and-keys): the two keys, the DSN, where they can go and how to rotate one.
* [Configuration](/docs/laravel/configuration), [User context](/docs/laravel/user-context) and [Testing your setup](/docs/laravel/testing): the Laravel client in full.
* [What opens an issue](/docs/issues/overview): every kind of issue, and the telemetry each is read from.
* [What LaraBug records](/docs/telemetry/overview): every kind of telemetry, its switch and its cost.
* [Filtering sensitive data](/docs/guides/filtering-sensitive-data): keeping passwords, keys and personal data out of what is sent.
* [Alerts and notifications](/docs/guides/alerts-and-notifications): Slack, Discord, Teams, email, webhooks and the mobile apps.
* [MCP server](/docs/integrations/mcp-server) and [HTTP API](/docs/integrations/http-api): reading LaraBug from an agent, or from your own code.
## Reading this with something other than your eyes
Every page has a markdown twin: add `.md` to its address, or ask the page itself for `Accept: text/markdown`. The **Copy** button in the bar above copies the page, or hands it to ChatGPT or Claude. The whole tree is indexed at [llms.txt](/llms.txt), and in one file at [llms-full.txt](/llms-full.txt). If it is the API you want rather than the documentation, [/api](/api) describes itself.
## Getting help
The [support page](/support) has the ways in. If something in these pages is wrong or missing, say so there: it is quicker to fix a page than to answer the same question twice.
---
Source: https://v4.larabug.com/docs/general/how-larabug-works.md
# How LaraBug works
Four words do most of the work in the rest of the documentation. They are worth two minutes.
## Applications
An application has its own keys, its own team, its own notification settings and its own history. An event belongs to exactly one application, and a plan's allowances are spread across all of yours.
Most teams run a separate application per environment: a production application and a staging application, so a staging mistake never pages anybody.
## Events
An event is one thing your application reported, and it counts towards one of two monthly allowances, repeats included:
* **Issues** are exceptions, JavaScript errors, CVE findings and detections. They are what a plan is priced on.
* **Telemetry** is everything underneath: requests, queries, logs, cache calls, mail, jobs, commands and scheduled tasks.
The two are counted apart. An account that has spent its telemetry allowance keeps receiving its exceptions, and the other way round.
That last part matters. An exception that fires ten thousand times in an hour is ten thousand events, which is why the Laravel client has a deduplication window and a sampling rate. Both are covered under [capturing exceptions](/docs/issues/exceptions).
## Issues and occurrences
An issue is a problem. An occurrence is one time it happened.
LaraBug groups incoming exceptions into issues by their class, their message and where they were thrown, so a `QueryException` from one endpoint is one row in your list however often it fires. Opening it shows the latest occurrence with its full context, and the ones before it.
You read issues. You count occurrences.
## Retention
Occurrences are kept for as long as your plan says, between 7 and 365 days, and then they rotate out. The issue itself stays, so the history of what broke survives; the individual reports behind it do not.
Nothing is deleted early, and nothing is kept late. If you need a report to outlive its window, export it before it goes.
## What happens to an event
1. Your application catches something worth reporting and hands it to a client.
2. The client filters it: your environment list, your ignore rules, your deduplication window, the fields you have told it to scrub.
3. What is left is posted to LaraBug over HTTPS.
4. LaraBug groups it into an issue, stores the occurrence, and tells whoever asked to be told.
Step two happens on your server, before anything leaves it. That is the part to read carefully if you log personal data: see [filtering sensitive data](/docs/guides/filtering-sensitive-data).
---
Source: https://v4.larabug.com/docs/general/projects-and-keys.md
# Applications and keys
## Creating an application
Sign in, open Applications, and add one. You need a name; the URL is optional and is only used to show the site's icon beside the name.
The application page shows its keys as soon as it exists, and every client needs them before it will send anything.
## The two keys
Every client authenticates with two values, both on the application's settings page.
| Key | What it is |
| --- | --- |
| Ingest key | Lets a client post events to this application, and reaches nothing else in your account. Rotatable, and safe to ship in a browser bundle. |
| Project key | Says which application a report is filed against. |
In the Laravel client they are `LB_KEY` and `LB_PROJECT_KEY`. In the JavaScript packages they are `loginKey` and `projectKey`: those names are the packages' own and are older than the ingest key, but the value to give them is the one above.
## The DSN
A DSN is both keys and the endpoint in one string, which is easier to paste into a deployment tool than three separate variables.
```env .env
LB_DSN=https://login_key:project_key@www.larabug.com/api/log
```
Where a client supports both, the DSN wins: if `LB_DSN` is set, the separate keys are ignored.
## Where the keys can go
Both of them can go in a browser. That is what the ingest key is for: it opens exactly one thing, posting events to one application, and it cannot read an issue or delete one. Every JavaScript bundle that reports browser errors ships it, which is unavoidable and by design.
Narrow it further with the allowed origins on the same settings page, which is the list of sites a report is accepted from.
What does not belong in a browser is the account token the [HTTP API](/docs/integrations/http-api) reads with. That one is your account.
## Rotating a key
Rotate the ingest key from the application's settings. The old one stops being accepted immediately, so deploy the new one first if you would rather not lose the events in between.
---
Source: https://v4.larabug.com/docs/laravel/installation.md
# Installing the Laravel client
Version 4 of `larabug/larabug` needs PHP 8.2 and Laravel 11, 12 or 13.
## Install the package
```bash
composer require "larabug/larabug:^4.0@beta" -W
```
Version 4 is in beta, so it is named: a bare `composer require larabug/larabug` installs the last stable release, 3.8, which is set up differently. `-W` lets Composer settle Guzzle on 7, which this release still needs; a new Laravel 13 application ships with Guzzle 8, and without it the install does not resolve.
## Add your DSN
```env .env
LB_DSN=https://ingest-key:project-key@www.larabug.com/api/log
```
The DSN is on the application's page until the application receives its first event, and on its settings page after that, filled in with the application's own keys. The pair still works, and the DSN wins when both are set:
```env .env
LB_KEY=your-ingest-key
LB_PROJECT_KEY=your-project-key
```
See [applications and keys](/docs/general/projects-and-keys).
## There is nothing to register
The package registers itself with Laravel's exception handler, so there is nothing to add to `bootstrap/app.php` or `config/logging.php`. Adding a `larabug` channel to your log stack, as version 3 asked, sends exceptions down a second path; leave it out.
Publishing the config is optional, and only needed to change a default:
```bash
php artisan vendor:publish --provider="LaraBug\ServiceProvider"
```
That writes `config/larabug.php`. Every option in it is documented under [configuration](/docs/laravel/configuration).
## Check it works
```bash
php artisan larabug:test
```
The command checks the keys and the environment, builds a test exception and sends it. The application's page notices it by itself within a few seconds.
Exceptions are only sent from the environments in `environments`, which is `production` until you change it. To test from your own machine without changing anything, treat that one command as production:
```bash
APP_ENV=production php artisan larabug:test
```
If nothing arrives, [troubleshooting](/docs/laravel/troubleshooting) starts with the four things that cause almost all of it.

## What reports by default
Out of the box, and only in the environments you have listed:
* Every unhandled exception.
* Every failed queue job, and every completed one.
* Known vulnerabilities in `composer.lock`, checked daily.
Nothing else is sent, and nothing is sent at all from an environment that is not on the list. The default list is `production`.
Requests, queries, logs, commands and scheduled tasks are each one switch away. [What LaraBug records](/docs/telemetry/overview) is the list, with what each one costs.
---
Source: https://v4.larabug.com/docs/laravel/configuration.md
# Configuration
Everything lives in `config/larabug.php`. Every key can be set from `.env` where it makes sense to, and the defaults are what most applications want.
## Credentials
| Key | Environment variable | Default | What it does |
| --- | --- | --- | --- |
| `dsn` | `LB_DSN` | empty | Both keys and the endpoint in one string. Wins over the pair below. |
| `login_key` | `LB_KEY` | empty | The application's ingest key. The option's name is older than the key. |
| `project_key` | `LB_PROJECT_KEY` | empty | Identifies the application. |
| `server` | `LB_SERVER` | `https://www.larabug.com/api/log` | Where reports are posted. Change it only for a self-hosted instance. |
| `verify_ssl` | `LB_VERIFY_SSL` | `true` | Leave it on. |
## What gets reported
| Key | Default | What it does |
| --- | --- | --- |
| `register_exception_handler` | `true` | Whether the package hooks Laravel's exception handler. Off means you report by hand. |
| `environments` | `['production']` | The only environments that send anything. |
| `except` | see the file | Exception classes that are never reported. |
| `blacklist` | see the file | Field names whose values are scrubbed before sending. |
| `sleep` | `60` | Deduplication window in seconds. The same exception is reported once per window. |
| `lines_count` | `12` | How many lines of code either side of the failing line are sent. |
| `project_version` | `null` | A version string attached to every report. |
`project_version` is worth setting. A commented example in the config file reads the short hash of the current commit, which turns "when did this start" into an answer:
```php config/larabug.php
'project_version' => trim(exec('git --git-dir ' . base_path('.git') . ' log --pretty="%h" -n1 HEAD')),
```
Run `php artisan config:cache` on deploy if you do that, or the shell call runs on every request.
## The blocks that record something
Most of the file is one block per kind of event, and each has a page of its own under [events](/docs/telemetry/overview).
| Block | Page | Default |
| --- | --- | --- |
| `requests` | [Requests](/docs/telemetry/requests) | Off |
| `livewire` | [Requests](/docs/telemetry/requests) | On, where requests are tracked |
| `jobs` | [Queue jobs](/docs/telemetry/queue-jobs) | On |
| `schedule` | [Scheduled tasks](/docs/telemetry/scheduled-tasks) | Off |
| `commands` | [Commands](/docs/telemetry/commands) | Off |
| `logs` | [Logs](/docs/telemetry/logs) | On, once the channel is added |
| `cve` | [Dependencies](/docs/issues/dependencies) | On |
## Caching
`config/larabug.php` is ordinary Laravel config, so `php artisan config:cache` applies. Nothing in it is read at a point where caching would break it, provided you clear the cache when you change it.
---
Source: https://v4.larabug.com/docs/laravel/user-context.md
# User context
An exception is easier to fix when you know who hit it.
## What is sent by default
If somebody is authenticated when the exception is thrown, the client attaches the user. With no other configuration that means the whole model, as `toArray()` gives it, which is almost certainly more than you want to store: names, email addresses, whatever else is on the row.
## Choosing what is sent
Implement `Larabugable` on the model and say exactly what LaraBug is given:
```php app/Models/User.php
use LaraBug\Concerns\Larabugable;
class User extends Authenticatable implements Larabugable
{
public function toLarabug(): array
{
return [
'id' => $this->id,
'plan' => $this->plan?->name,
];
}
}
```
An id and the one or two attributes that change how the application behaves are usually enough to reproduce a bug, and an id is not personal data in the way an email address is.
This is the recommended setup for any application that holds personal data. It is one method, and it turns the user block from "everything on the row" into "what we need".
## Not sending a user at all
Return an empty array from `toLarabug()`. The block is then present and empty rather than absent, which is the honest answer: somebody was signed in, and you chose not to record who.
## Guests
No authenticated user means no user block. The request, the route and the IP handling still apply, and those are covered under [filtering sensitive data](/docs/guides/filtering-sensitive-data).
---
Source: https://v4.larabug.com/docs/laravel/testing.md
# Testing your setup
Finding out that reporting is broken when you need a report is the wrong time to find out.
## The test command
```bash
php artisan larabug:test
```
It builds a test exception and runs it through everything: the environment check, the deduplication window, the filters, the HTTP call, and prints what happened at each step. It exits zero either way, so read its output rather than its exit code.
A matching event should be in your LaraBug application within a few seconds.
## Keeping quiet locally
The default `environments` list is `['production']`, so a local machine reports no exceptions without any further setting. That is usually all you want, and it is also why the test command says the environment is not allowed when you first run it on your laptop. Run it once as `APP_ENV=production php artisan larabug:test` to see the whole path work.
Queue jobs, logs and the other monitors do not check `environments`, so a local install that reports no exceptions can still send those.
## Asserting on reports in your own tests
To check that your code reports an exception without anything leaving the machine, swap the client for the fake:
```php tests/Feature/OrderTest.php
use LaraBug\Facade as LaraBug;
LaraBug::fake();
$this->post('/orders', $payload)->assertStatus(500);
LaraBug::assertSent();
```
Nothing is posted, and the assertion fails if your code swallowed the exception instead of reporting it.
## Do not run the test command in CI
It reports a real event to a real LaraBug application, from a machine that is not where your application runs. Run it once by hand after a deploy to a new environment, and let CI check the things that are actually its business: that the package installs, that `php artisan config:cache` succeeds, and that your own tests pass.
---
Source: https://v4.larabug.com/docs/laravel/troubleshooting.md
# Troubleshooting
Nearly everything is one of the first four.
## Nothing arrives at all
**The environment is not on the list.** `environments` defaults to `['production']`, and `APP_ENV` on the machine you are testing is probably not that. This is the single most common cause.
**Version 3 is installed.** A bare `composer require larabug/larabug` installs 3.8, the last stable release. `composer show larabug/larabug` says which you have; [installation](/docs/laravel/installation) has the command for version 4.
**The keys are missing or wrong.** Run `php artisan larabug:test`, which says which of the two it is.
**The config is cached from before your change.** `php artisan config:clear`, then try again.
## One exception arrives and the rest do not
That is `sleep` doing its job. The same exception from the same place is reported once per window, 60 seconds by default. Lower it while you are testing if you need to see each one.
## Everything arrives twice
Two things are reporting: the exception handler and a manual `LaraBug::handle()` call in a `catch` block for the same exception, or a `larabug` channel left in the log stack from version 3. Keep the exception handler and remove the other.
## Queue jobs are missing
Check, in order: `jobs.track_jobs` is on, the queue is not in `ignore_queues` (or is in `only_queues` when that list is set), `sample_rate` is not sampling it away, and the worker has been restarted since your last deploy. A worker holds the old config until it is restarted.
## The user block is bigger than expected
Without `Larabugable` on the model, the whole model is sent. [User context](/docs/laravel/user-context) is one method that fixes it.
## Still stuck
Turn on `report_sdk_errors` while you are looking, which makes the client report its own failures rather than swallowing them, and check your application log for what it says. Turn it off afterwards.
If that gets you nowhere, [write to us](/support) with the project key and roughly when you tested. We keep our own errors in LaraBug, so the report usually finds the cause faster than a description of it.
---
Source: https://v4.larabug.com/docs/issues/overview.md
# What opens an issue
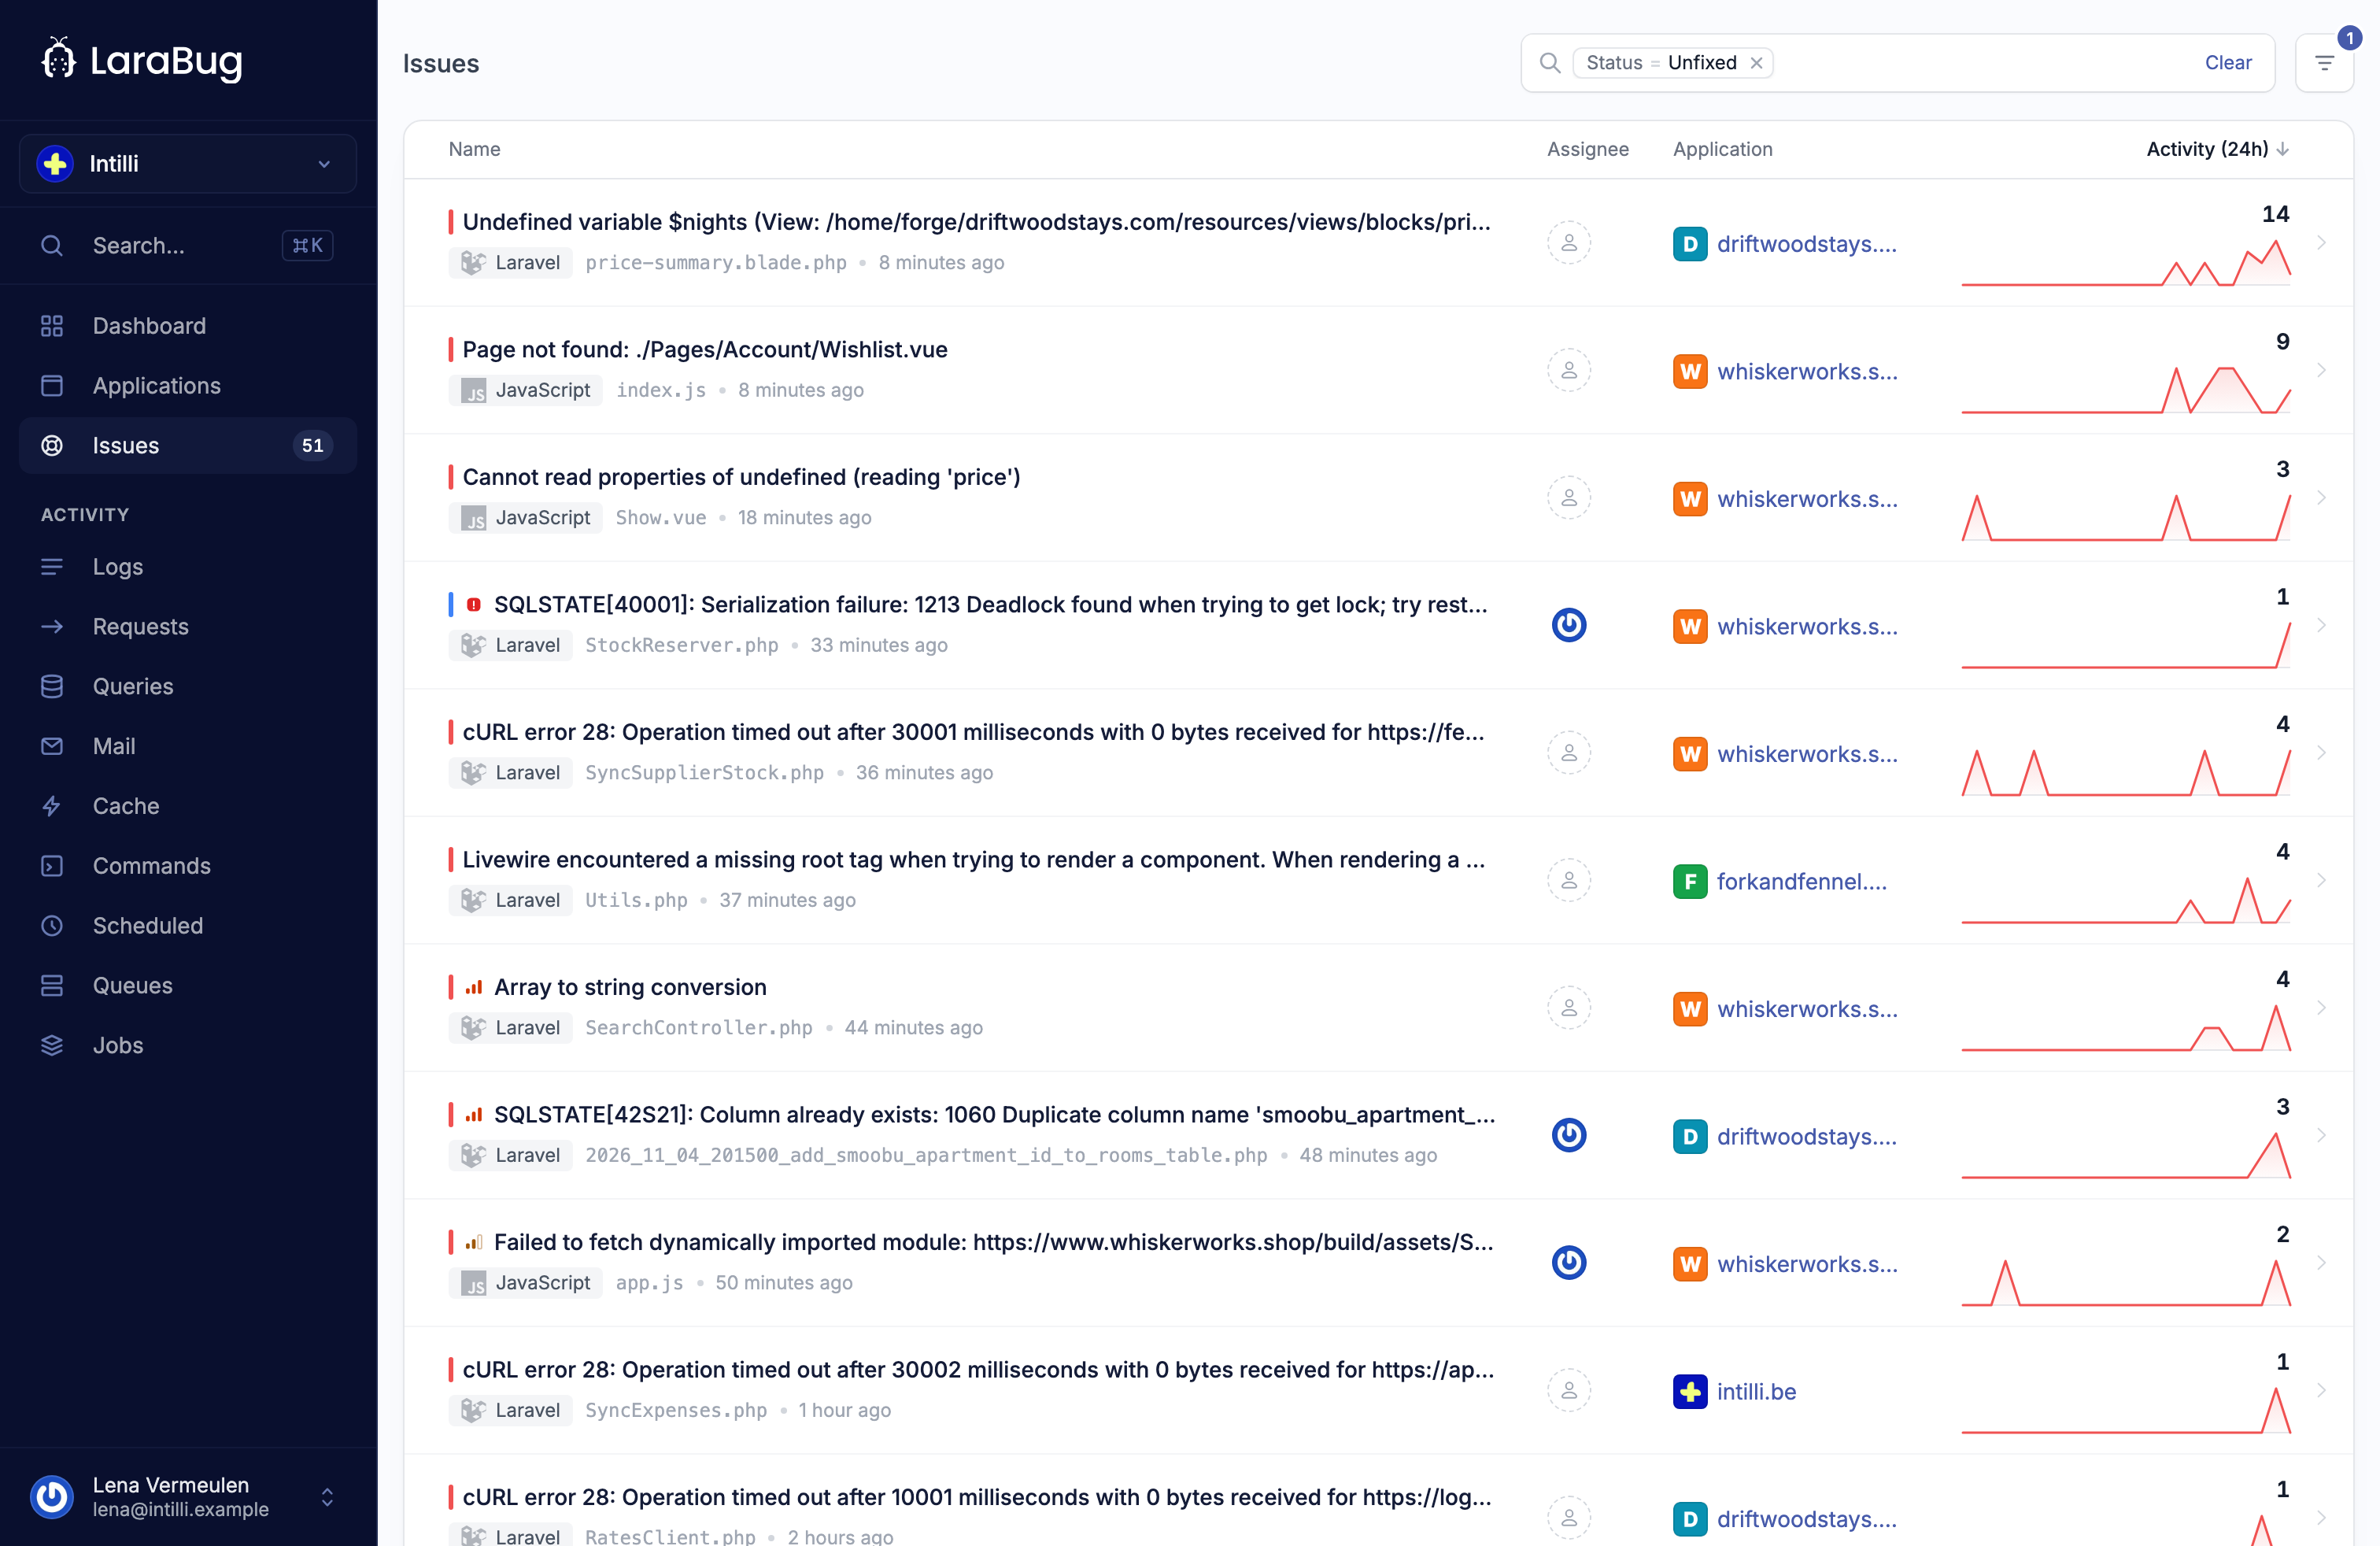
An issue is one problem in your application, with every time it happened behind it. Two kinds arrive as issues: an [exception](/docs/issues/exceptions) the client caught, and a [vulnerable package](/docs/issues/dependencies) it found in a lockfile. Twenty more are read out of the telemetry: a route that got slow, a job that keeps failing, a task that stopped running. Nothing has to be thrown for those; each is a reading the panel keeps watching, and the issue opens the moment the reading crosses the threshold the application sets for it. They all land in the same list, and the list treats them the same.
## Exceptions
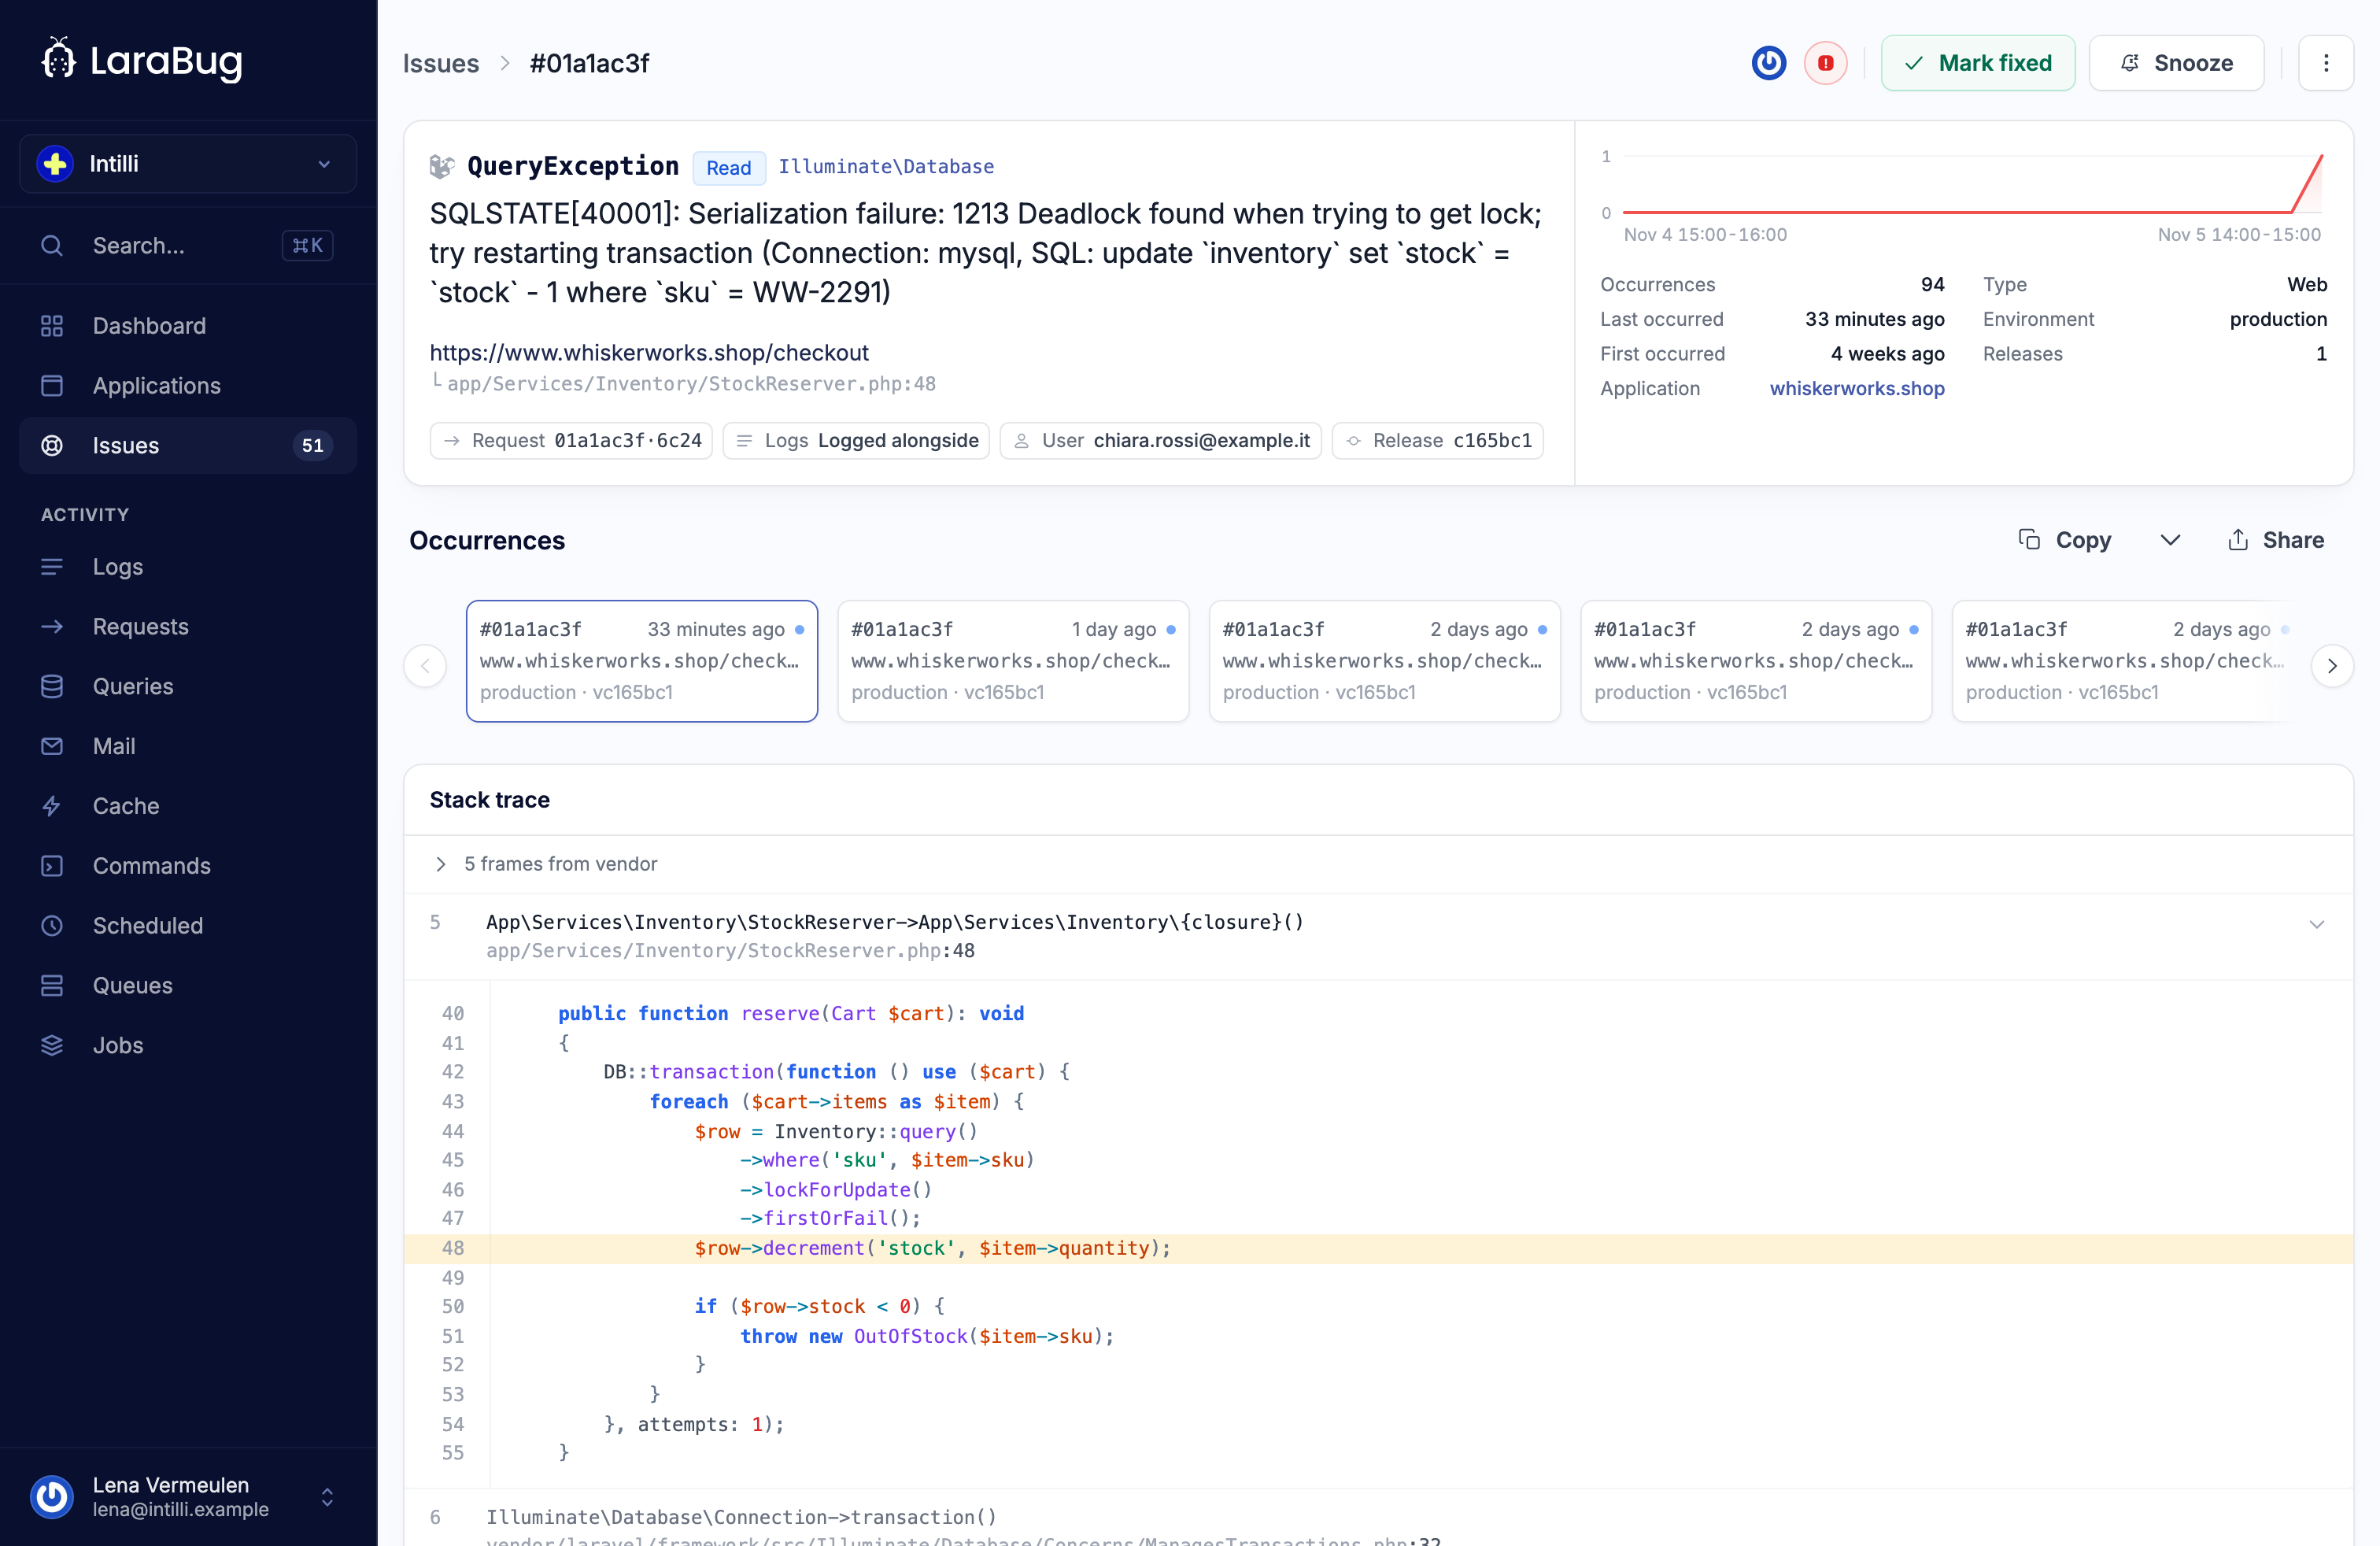
Everything the exception handler reports, and everything you hand to `report()`, arrives with the request, the user and the source around the line that threw. The same exception from the same place is one issue with many occurrences. [Exceptions](/docs/issues/exceptions) has the switches, the environments and how to leave some out.
## JavaScript errors
The browser packages report what breaks in the page, mapped back to your source with [source maps](/docs/javascript/source-maps), into the same list as the server's exceptions. Start at the [JavaScript installation](/docs/javascript/installation).
## Deprecations
Each deprecated call PHP reports is grouped per line of code, so one issue says where the next major version will bite. They come in through the [log channel](/docs/telemetry/logs#deprecations).
## Dependency findings
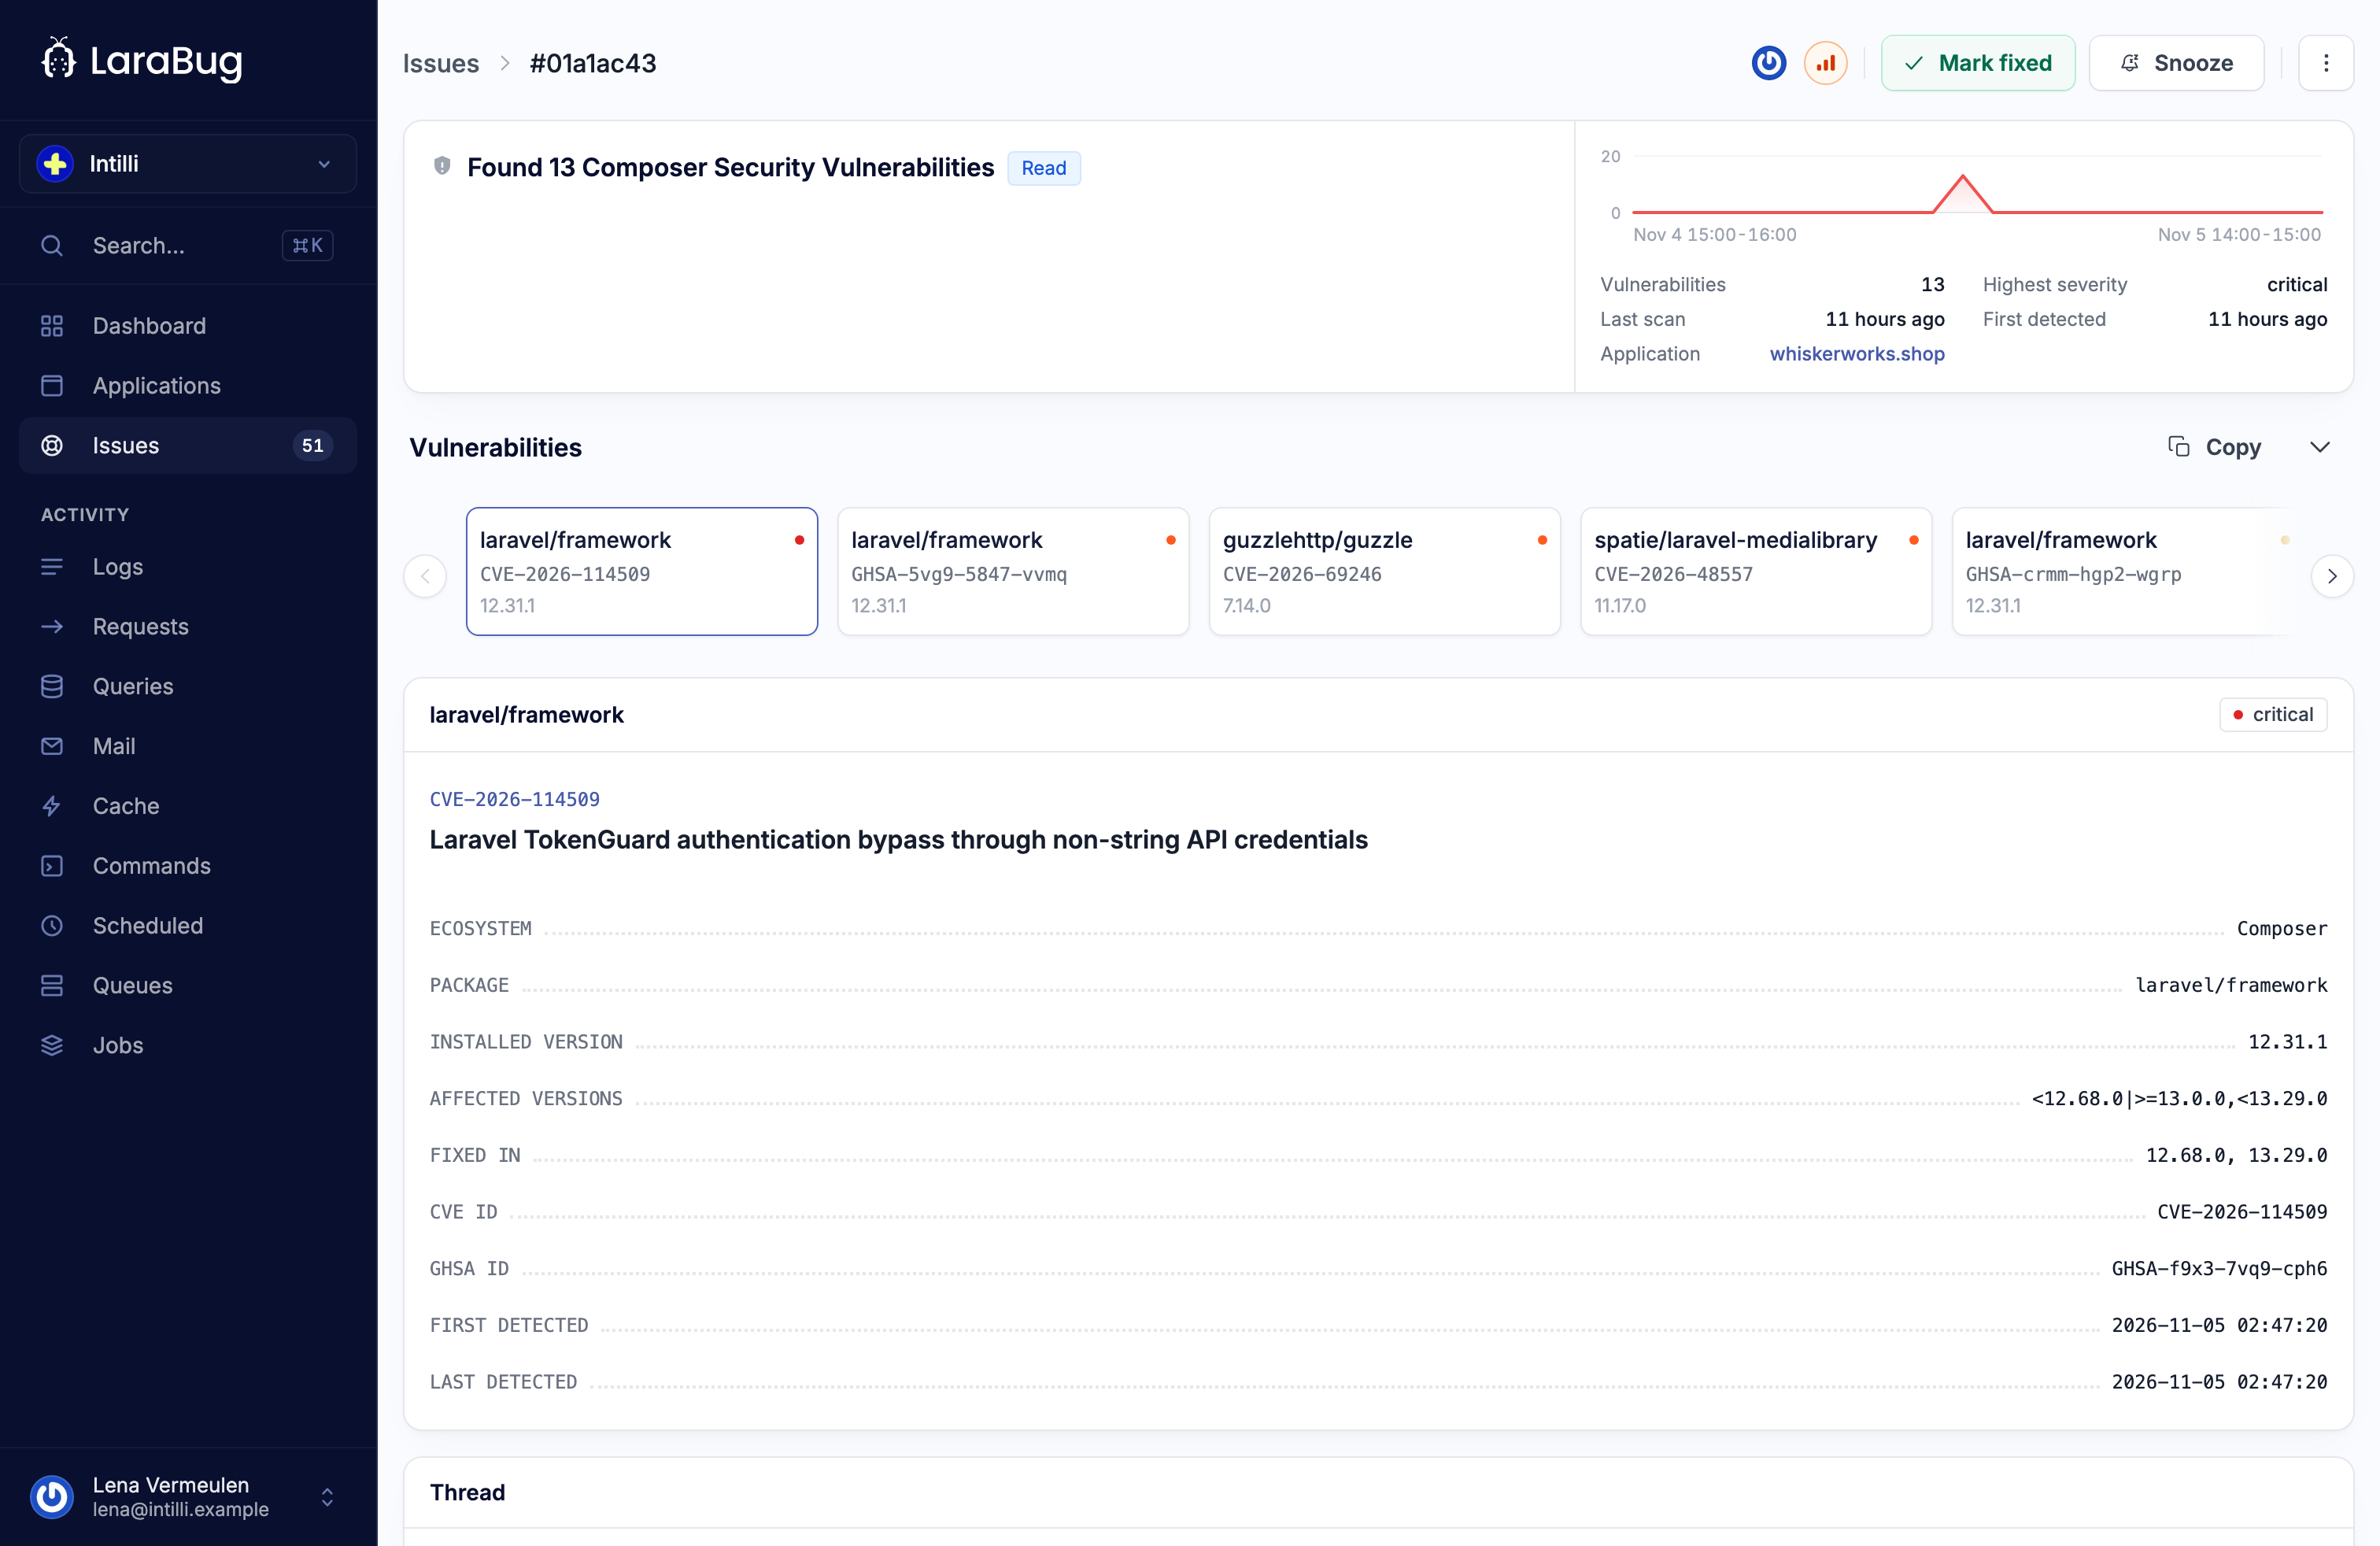
The client reads `composer.lock`, and the npm lockfiles when you have them, and every night the panel checks them against the advisory database. Each application gets one issue listing every vulnerable package and the version that fixes it. [Dependencies](/docs/issues/dependencies) says what is scanned and when.
## From requests
Four kinds are read out of [request tracking](/docs/telemetry/requests), so they need it switched on.
### Slow routes
A route whose p95 has gone past the threshold the application sets.
### Error rates
A route failing more often than it should, counted over its 4xx and 5xx responses.
### Large responses
A response grown past the size you set, which is usually a page that started returning something it should not.
### High memory
A route whose p95 memory spikes above the threshold.
## From outgoing calls
Calls through Laravel's HTTP client travel with the [request](/docs/telemetry/requests) that made them.
### Failing dependencies
An outgoing call that keeps failing, named by its host.
### Slow dependencies
An outgoing call that got slower than it used to be.
## From queries
Statements travel with the [request](/docs/telemetry/requests) that ran them, and the [Queries](/docs/telemetry/queries) page ranks them.
### Slow queries
One statement, timed, with the route it runs on.
### N+1 queries
The same statement repeated through one request, which is the signature of a missing eager load.
### Missing indexes
A scan reading far more rows than it returns. The client has to send query plans for this one; [Queries](/docs/telemetry/queries#query-plans) says how.
## From queue jobs
Read out of [queue job tracking](/docs/telemetry/queue-jobs), which is on by default.
### Failing jobs
A job class failing more often than it should, with the exception that killed it.
### Slow jobs
A job taking longer than it used to.
### Queue backlogs
Ready jobs waiting longer than they should on one queue, which is usually a worker that died.
## From scheduled tasks and commands
Read out of [scheduled task](/docs/telemetry/scheduled-tasks) and [command](/docs/telemetry/commands) tracking, both off until you switch them on.
### Failing schedules
A scheduled task that keeps failing.
### Stopped schedules
A task that should have run and never fired: the cron that quietly stopped.
### Failing commands
An Artisan command exiting with an error.
## From mail and notifications
Both travel with the [request](/docs/telemetry/requests) that sent them; [Mail and notifications](/docs/telemetry/mail-and-notifications) says what is kept.
### Failing mail
A mailable that will not go out.
### Failing notifications
A notification a channel keeps refusing.
## From cache
### Low cache hit rates
A key prefix missing more than it hits, read out of the [cache operations](/docs/telemetry/cache) a request made.
## From logs
### Logged errors
Errors written to the [log channel](/docs/telemetry/logs) without an exception behind them.
## One list, whatever the kind
Every issue has the same handles. Hand it to someone, give it a priority, snooze the ones you already know about, and say what causes it in the thread; every change is on the trail. An issue you marked fixed that comes back reopens itself, so a regression is never a second issue. [Alerts and notifications](/docs/guides/alerts-and-notifications) work the same way for all of them: a new issue, one that came back, or one of a kind you asked to hear about, where your team already is.
## Opening and closing
An exception stays open until somebody marks it fixed. A detection opens itself when its reading crosses the threshold and, for most kinds, closes itself once the reading has stayed clear for a while, so a slow afternoon does not leave a stale issue behind. The thresholds are per application, in its settings in the panel.
## What it costs
Every exception counts towards your monthly issues allowance, repeats included, which is what deduplication and the ignore lists on the [Exceptions](/docs/issues/exceptions) page are for. A detection is read out of telemetry that is already counted, so it adds nothing to the bill. [What LaraBug records](/docs/telemetry/overview) has the telemetry's own switches and costs.
---
Source: https://v4.larabug.com/docs/issues/exceptions.md
# Capturing exceptions
An exception event is one time something threw. LaraBug groups them into issues, so the page you read is the problem and the events behind it are the times it happened.
## Automatically
With `register_exception_handler` left at `true`, every unhandled exception in a listed environment is reported. There is nothing to write.
## By hand
To report something you have caught yourself:
```php app/Http/Controllers/OrderController.php
use LaraBug\Facade as LaraBug;
try {
$gateway->charge($order);
} catch (GatewayException $e) {
LaraBug::handle($e);
return back()->with('error', 'The payment did not go through.');
}
```
## With your own context
The third argument attaches whatever you know about the moment:
```php
LaraBug::handle($e, 'php', [
'order_id' => $order->id,
'gateway' => 'mollie',
'attempt' => $attempt,
]);
```
It arrives on the occurrence as its own block, beside the request and the user. Keep it small and keep it free of anything you would not want stored: it is sent exactly as given, and the `blacklist` does not apply to keys you invent.
## Not reporting something
Two ways, and they answer different questions.
`except` is for exception classes that are noise everywhere:
```php config/larabug.php
'except' => [
Illuminate\Auth\AuthenticationException::class,
Illuminate\Validation\ValidationException::class,
],
```
`sleep` is for exceptions that are worth knowing about but not ten thousand times:
```php config/larabug.php
'sleep' => 60,
```
The same exception, from the same place, is reported once per that many seconds. Raise it on a busy application; the events you save are duplicates of one you already have.
## Environments
```php config/larabug.php
'environments' => ['production'],
```
Nothing is sent from an environment that is not on this list, which is why a local machine stays quiet without any other setting. Add `staging` when you want staging reporting, ideally to an application of its own so a staging mistake never pages anybody.
## Release tracking
Set `project_version` and every report carries it. An issue that starts at a version you deployed this morning is a different conversation from one that has been there for a year.
---
Source: https://v4.larabug.com/docs/issues/dependencies.md
# Dependency scanning
The client reads your `composer.lock`, compares it against the advisory database, and reports the packages with a known vulnerability. The findings arrive in the panel beside your exceptions, with the version that fixes each one.
## What is scanned
Two ecosystems, each against its own advisories.
| Ecosystem | Lockfile | Advisories from |
| --- | --- | --- |
| Composer | `composer.lock` | Packagist's security advisory database, filled in from GitHub's |
| npm | `package-lock.json`, `yarn.lock` or `pnpm-lock.yaml` | GitHub's advisory database, through OSV |
Each ecosystem gets one CVE issue per application, titled with its name: "Found 3 npm Security Vulnerabilities" sits beside "Found 2 Composer Security Vulnerabilities" rather than inside it, because the two are fixed with different tools. The issue list filters on the ecosystem, and so does the `list_vulnerabilities` tool of the [MCP server](/docs/integrations/mcp-server).
## npm lockfiles
Two clients send one:
* The Laravel client from **4.0.0-beta.18**, which reads the lockfile in your application's root alongside `composer.lock`.
* **`@larabug/vite`**, with its dependency scanning turned on, which reads it when Vite builds. That covers an application with no PHP side at all.
What is sent is the installed set after the lockfile is flattened: each package's name and version, and nothing from your code. The same package can be installed at several versions, and each version is matched on its own. Development dependencies are matched too, because in a Laravel application the packages Vite puts into the page are usually `devDependencies`.
A version is matched by SemVer order, so a prerelease counts as older than its release. `2.0.0-beta.3` is affected by an advisory fixed in `2.0.0`. A version that is not a release, such as a git url or a local path, is never matched.
An unchanged lockfile is only scanned once a day. When a new advisory is published, the lockfiles already sent are matched against it straight away, so a finding does not wait for the next scan.
## Turning it on and off
```php config/larabug.php
'cve' => [
'enabled' => env('LB_CVE_ENABLED', true),
],
```
On by default. What is sent is the package names and versions from your lock file, nothing else: no source, no configuration, no data.
## When it runs
```php config/larabug.php
'trigger' => env('LB_CVE_TRIGGER', 'both'),
'schedule' => env('LB_CVE_SCHEDULE', 'daily'),
'request_throttle_hours' => env('LB_CVE_REQUEST_THROTTLE_HOURS', 24),
```
`trigger` takes `schedule`, `request` or `both`.
* `schedule` runs it from Laravel's scheduler, at the frequency in `schedule`. It needs the scheduler to actually be running.
* `request` piggybacks on a web request, at most once every `request_throttle_hours`. It is the fallback for an application with no scheduler.
* `both` is the default and covers either situation.
## Development dependencies
```php config/larabug.php
'include_dev' => env('LB_CVE_INCLUDE_DEV', false),
```
Off by default. A vulnerability in a test runner that never ships is not the same as one in a package serving requests, and including them buries the second kind in the first.
Turn it on if your deployment installs dev dependencies.
## Which environment reports
```php config/larabug.php
'environment' => env('LB_CVE_ENVIRONMENT'),
```
Empty means the same environment list the rest of the client uses. Set it to one environment when you run several with the same lock file and want one of them doing the scanning.
## The lock
```php config/larabug.php
'lock_path' => env('LB_CVE_LOCK_PATH'),
```
A file lock stops two processes scanning at once. The default location is Laravel's storage path, which is right unless storage is shared between servers, in which case give each one a path of its own.
---
Source: https://v4.larabug.com/docs/telemetry/overview.md
# What LaraBug records
An event is one thing your application reported. This section is one page per kind: what it is, what has to be switched on for it to arrive, and what it costs you.

## The catalogue
| Event | What it is | What collects it |
| --- | --- | --- |
| [Requests](/docs/telemetry/requests) | One trip through your application, with the work it did. | `requests.track_requests` |
| [Exceptions](/docs/issues/exceptions) | Something threw. | `register_exception_handler` |
| [Queries](/docs/telemetry/queries) | The SQL a request ran, and how long each statement took. | inside a request |
| [Queue jobs](/docs/telemetry/queue-jobs) | A job finished, or failed. | `jobs.track_jobs` |
| [Scheduled tasks](/docs/telemetry/scheduled-tasks) | A scheduled command ran, or did not. | `schedule.track_scheduled_tasks` |
| [Commands](/docs/telemetry/commands) | An Artisan command ran. | `commands.track_commands` |
| [Logs](/docs/telemetry/logs) | A log record, from the level you pick upwards. | the `larabug-logs` channel |
| [Mail and notifications](/docs/telemetry/mail-and-notifications) | What your application sent, and how far it got. | inside a request |
| [Cache](/docs/telemetry/cache) | Hits, misses, writes and forgets. | inside a request |
| [Dependencies](/docs/issues/dependencies) | A package in `composer.lock`, or in an npm lockfile, with a known CVE. | `cve.enabled` |
## Two switches, and both have to be on
Every kind passes two gates.
The client decides whether to collect it. That is the switch in the table above, in `config/larabug.php`, and it is the one that costs your application anything: with it off, nothing is registered, no listener is subscribed, and there is no work to skip.
The application in LaraBug decides whether to accept it. Open the application in the panel and its features are in the settings. A client sending a kind the application does not accept is refused, and backs off rather than retrying.
A new application accepts exceptions, queue jobs and dependency findings, because those are the three the client sends without being asked. Requests, logs, commands and scheduled tasks are off on both sides until you turn them on.
## What a request carries
Queries, outgoing HTTP calls, mail, notifications, cache operations and Livewire updates are not events of their own. They are recorded against the request that caused them and travel with it.
Two things follow. With request tracking off, none of them arrive at all. And because requests are sampled, what you get is a representative tenth rather than the lot.
## What the console does instead
Request tracking is HTTP only. A queue worker, an Artisan command and a scheduled task are not requests, so the queries they run are not collected. Each reports its own event instead: the job, the command, the task, with its duration and how it ended.
## What it costs
Every request, job, command and task counts towards your monthly telemetry allowance, and every exception towards your issues allowance, repeats included. The three levers are the same everywhere, and each page says what its defaults are:
* **Sampling.** Requests are kept at one in ten. Jobs can be sampled the same way.
* **Deduplication.** The same exception, from the same place, is reported once a minute.
* **Ignoring.** Paths, queues, job classes, commands and exception classes can all be left out entirely.
What the telemetry raises on its own, a slow route or a failing job, is on [What opens an issue](/docs/issues/overview). [How LaraBug works](/docs/general/how-larabug-works) covers what happens to an event once it arrives: issues, occurrences and retention.
---
Source: https://v4.larabug.com/docs/telemetry/requests.md
# Requests
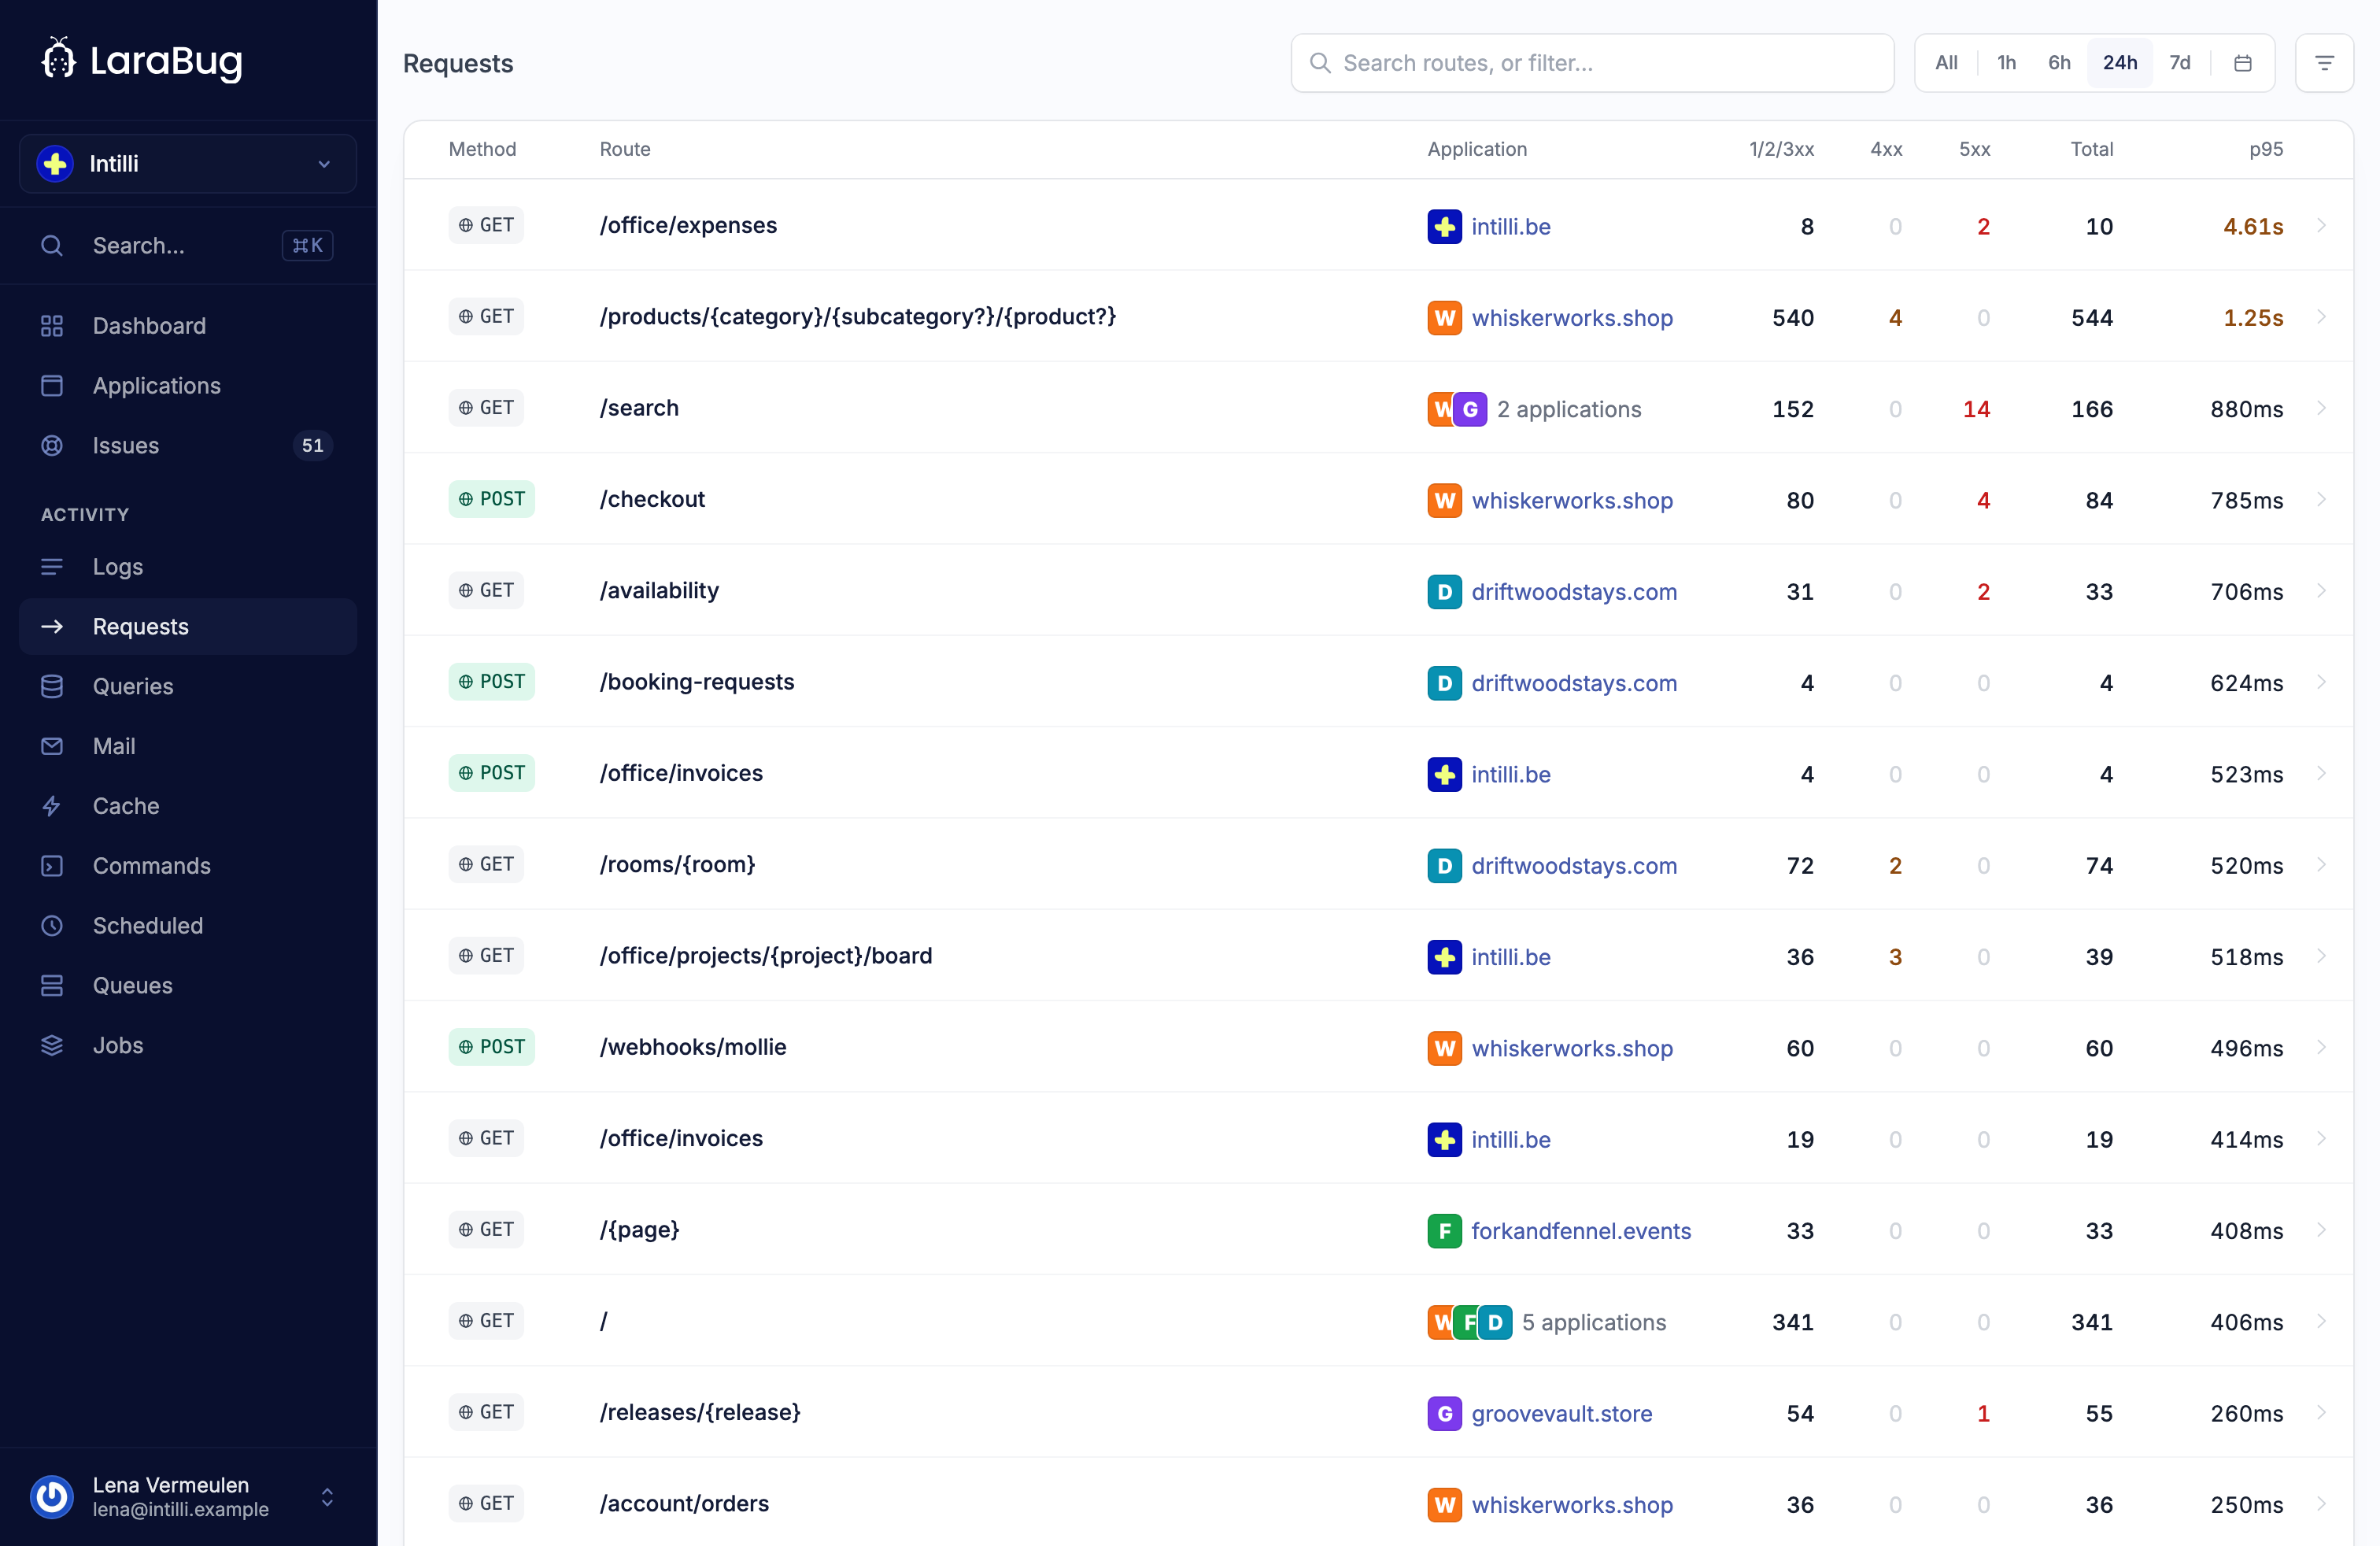
A request event is one trip through your application: the route, the status, the time it took and where the time went. It fills the performance pages, and it is the envelope that queries, mail, notifications and cache operations arrive in.
## Turning it on
```env .env
LB_TRACK_REQUESTS=true
```
Then accept **Requests** on the application in the panel.
> **Note.** It is off by default because it is the one kind of tracking that touches every request you serve. With the switch off the middleware is never pushed and the listeners are never subscribed, so the cost is nothing rather than nearly nothing.
## Sampling
```php config/larabug.php
'sample_rate' => env('LB_REQUEST_SAMPLE_RATE', 0.1),
'exception_sample_rate' => env('LB_REQUEST_EXCEPTION_SAMPLE_RATE', 1.0),
```
One request in ten, decided when the request arrives rather than when it ends: deciding at the end would mean paying to collect everything first, including the nine you throw away.
The decision is revisited twice. Once when the route is known, so the ignore list can drop a request that had already started recording. And once if the request throws, at `exception_sample_rate`, because the request that failed is the one worth having. At the default of `1.0` every failing request is kept, whatever the coin said at the door.
## Ignoring paths
```php config/larabug.php
'ignore_paths' => [
'/horizon*',
'/telescope*',
'/_debugbar*',
'/up',
'/health*',
],
```
Health checks and dashboards: traffic you serve, but not traffic worth measuring. The pattern matches the path, and `*` is the only wildcard.
## What is recorded
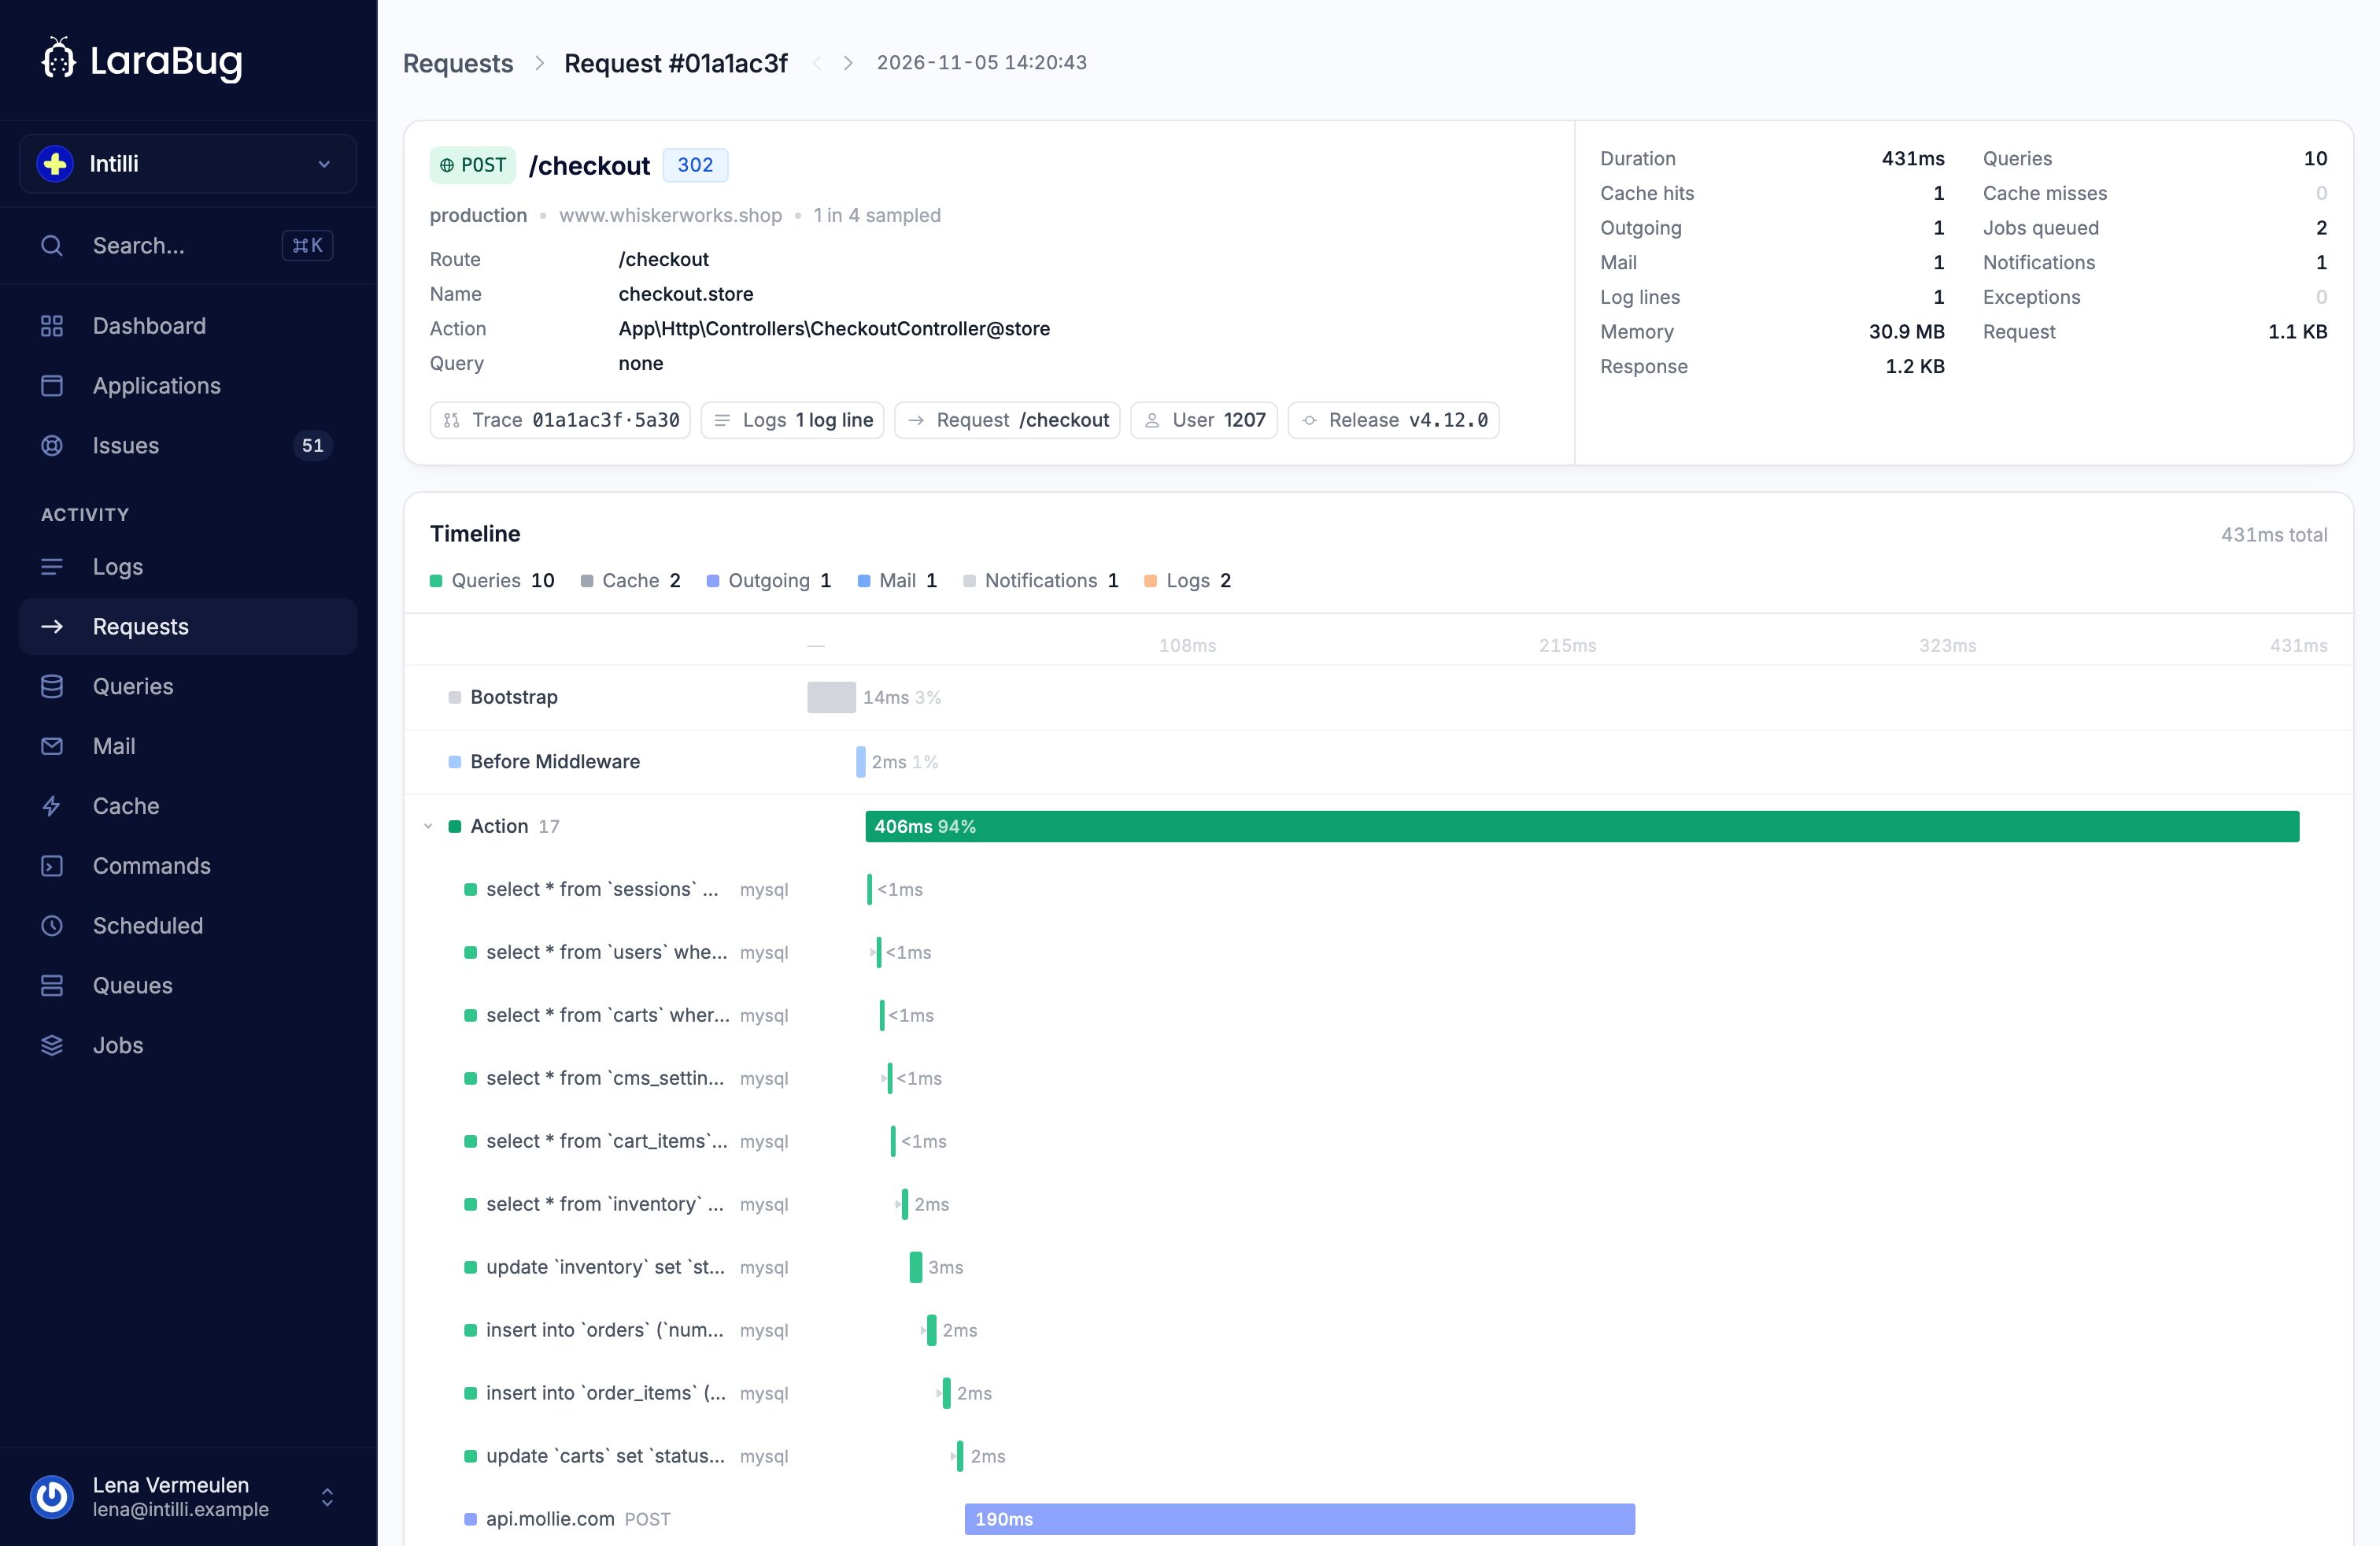
The route and its method, the status, the total duration and the time in each stage: before your middleware, inside the action, after it, and to the response being sent. Then, for the work inside it, a count and the detail of each:
| Kind | Detail kept |
| --- | --- |
| Queries | The normalised statement, the connection, the duration, where in the request it ran. |
| Outgoing HTTP | The method, the host and path, the status, the duration. Query values are stripped. |
| Mail | The mailable, the subject, how many recipients, how long the send took. |
| Notifications | The notification class, the channel, the notifiable type, whether it worked. |
| Cache | The operation, the store, the key prefix, the TTL on a write. |
| Livewire | The component, the method, the parameters and the property updates. |
## Caps
| Key | Default | What it limits |
| --- | --- | --- |
| `max_queries` | `100` | Statements kept per request. |
| `max_outgoing` | `50` | Outgoing HTTP calls. |
| `max_mail` | `50` | Mail messages. |
| `max_notifications` | `50` | Notifications. |
| `max_cache_events` | `100` | Cache operations. |
| `max_livewire_events` | `100` | Livewire updates. |
The counters keep counting past the cap. A request that ran four thousand queries still says four thousand; what stops is the list of statements, because the reason to look at that request is the number rather than the four thousandth statement.
## What is not sent
| Key | Default | What it does |
| --- | --- | --- |
| `capture_ip` | `true` | The client address. |
| `capture_user` | `true` | The authenticated user, through [user context](/docs/laravel/user-context). |
| `capture_headers` | `true` | Request headers, with `redact_headers` replaced by a constant marker. |
| `capture_payload_on_error` | `false` | The request body, and only on a 5xx, and never on a GET. |
| `capture_mail_recipients` | `false` | Full addresses instead of the domains they were sent to. |
| `capture_cache_keys` | `false` | Whole cache keys instead of the part before the first colon. |
`redact_fields` is applied to a captured payload depth first and by substring, so `card[cvv]` and `user.password_confirmation` are both caught by the short list in the config.
## Livewire
```php config/larabug.php
'livewire' => [
'track_livewire' => env('LB_TRACK_LIVEWIRE', true),
'capture_parameters' => env('LB_LIVEWIRE_CAPTURE_PARAMETERS', true),
'capture_updates' => env('LB_LIVEWIRE_CAPTURE_UPDATES', true),
'max_value_length' => env('LB_LIVEWIRE_MAX_VALUE_LENGTH', 255),
],
```
A Livewire update is an HTTP request to one endpoint, which on its own tells you nothing. With this on, the request says which component was addressed and which method ran, and the waterfall reads as the interaction rather than as another POST to `/livewire/update`.
## Across applications
A request and the jobs it queued are already one trace. A call from one of your applications to another can join the same trace, when both report to LaraBug, but only once the calling side is told which hosts are yours:
```env .env
LB_TRACE_PROPAGATION_TARGETS=billing.example.com,*.internal.example.com
```
That fills `requests.trace_propagation_targets`, which is empty by default and so sends nothing anywhere. With hosts in it, the client adds a W3C `traceparent` header to calls made through Laravel's `Http` client to those hosts, and the application on the other end records its request as a child of yours. The trace page then shows both, with whatever each of them went on to start.
* List only applications you run yourself. A trace id has no business reaching a payment provider, a mail service or somebody's webhook.
* A host is matched on its name, without the port. `*.example.com` covers every host below `example.com` but not `example.com` itself, so list both if you want both.
* Guzzle used directly, outside the `Http` facade, sends nothing.
* The calling application needs client 4.0.0-beta.12 or newer, and the receiving one needs request tracking on.
The trace only crosses into applications you can open. If the other application is one you are not on, the trace stops at your side of the call, and nothing of the other side is shown.
## Batching
Requests are sent in batches of `batch_size`, twenty by default, and a batch that fails is retried `max_retries` times before it is dropped. Nothing is sent inside the request being measured: the flush happens after the response has gone.
---
Source: https://v4.larabug.com/docs/telemetry/queries.md
# Queries
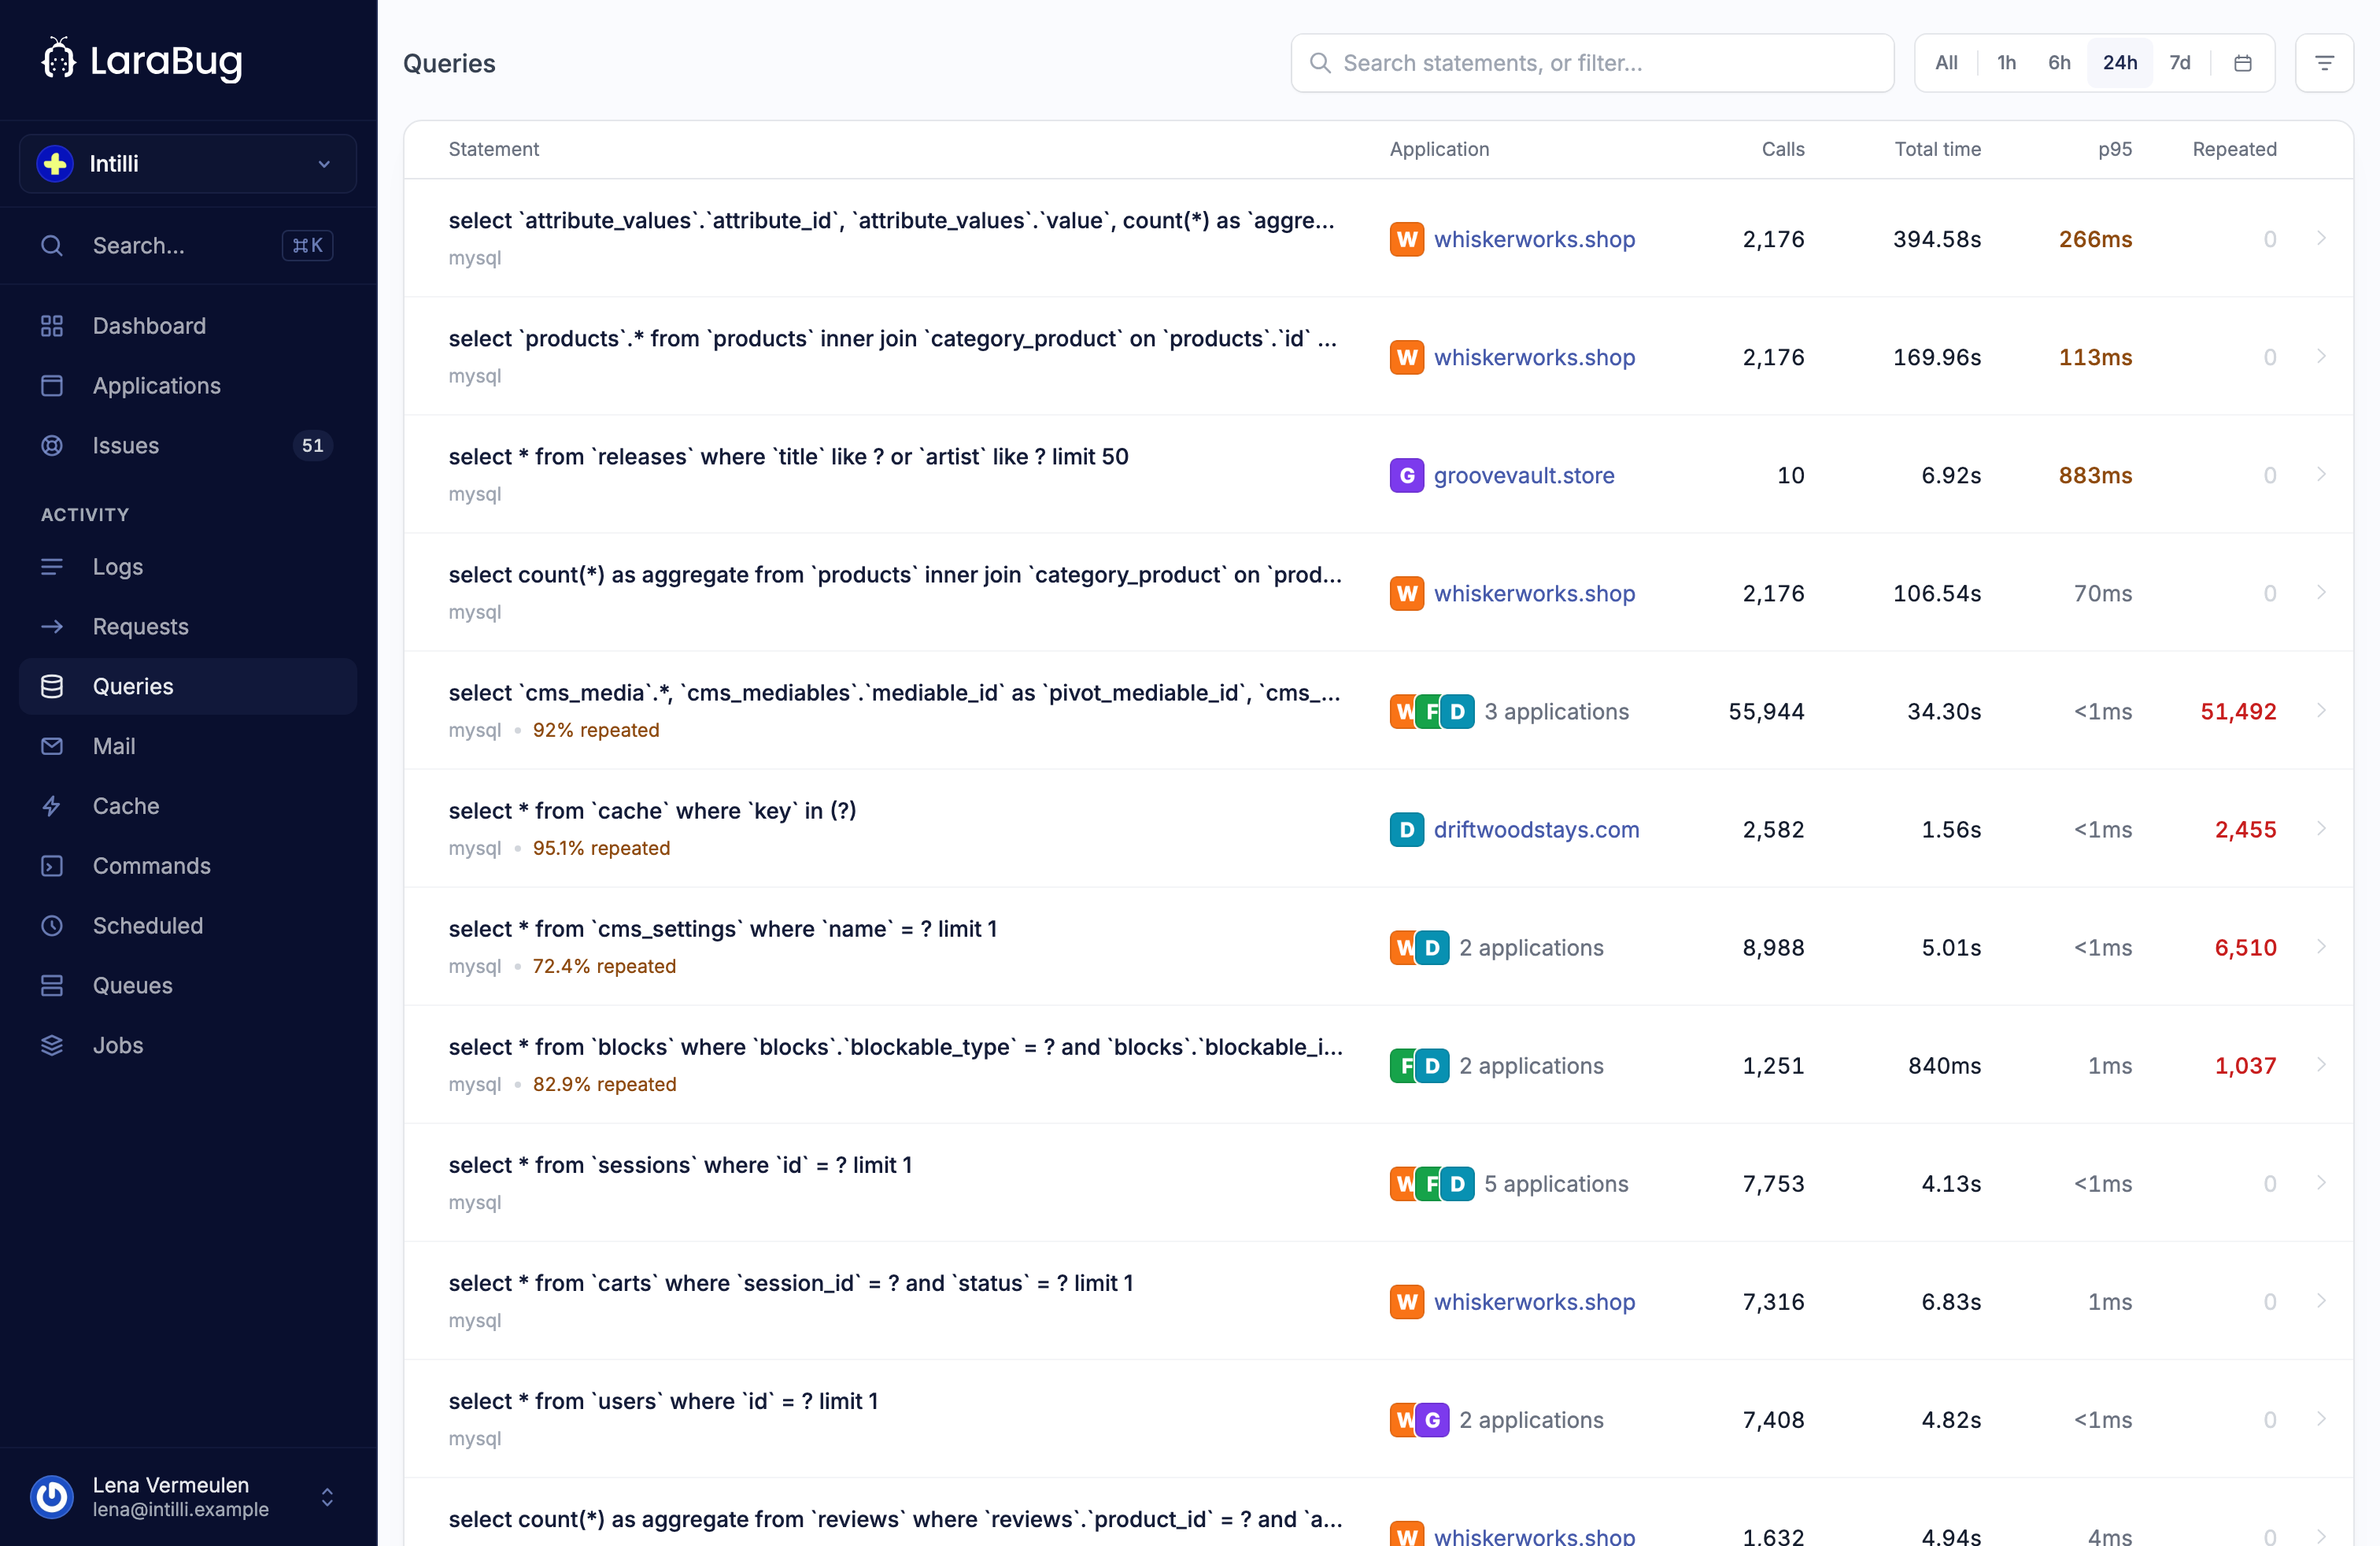
Every statement a recorded request ran, with the time it took and where in the request it ran.
## What turns it on
Queries are collected inside a [request](/docs/telemetry/requests), so `requests.track_requests` is the switch, and the application has to accept **Requests**. There is nothing else to enable.
The other side of that: a query run by a queue worker, an Artisan command or a scheduled task is not collected, because none of those are requests.
## What is sent
The statement as Laravel hands it over, which is the SQL with placeholders in it. Bindings are not sent, so the values your users typed never leave the server.
Two shapes are collapsed before sending, because both blow up the number of distinct statements for no benefit:
```sql
select * from users where id in (?, ?, ?) -> select * from users where id in (...?)
insert into logs values (?, ?), (?, ?) -> insert into logs values (...?)
```
What arrives is the normalised statement, its hash, the connection name, the duration in milliseconds, and the offset from the start of the request.
## What the panel does with it
Grouping is by that hash, so one statement is one row however many times it ran, across every request that ran it. From there:
* The slowest statements, by total time rather than by one unlucky run.
* The N+1 shapes: one statement repeated inside a single request, which is the signature of a missing eager load.
* The endpoints a statement runs on, which is usually the answer to where to fix it.
## Limits
`requests.max_queries` keeps a hundred statements per request. The counter is not capped, so a request that ran four thousand still reports four thousand, and it is the count that tells you to look.
## Query plans
A slow statement is slow for a reason, and the commonest one is that no index lets the database skip rows, so it reads the whole table on every run. Laravel cannot tell you that. The database can, if somebody asks it for the plan, and the client will ask on your behalf once you let it:
```env .env
LB_QUERY_EXPLAIN=true
```
Off by default, because it runs a statement of LaraBug's own against your database. What it runs, and when:
* **A plain `EXPLAIN`, never `EXPLAIN ANALYZE`.** The planner says what it would do without the query being executed.
* **Only on a slow `SELECT`.** Nothing that writes is ever explained.
* **At most once per statement per hour.** A statement that stays slow is explained again an hour later, so its plan keeps up with your schema.
* **On MySQL, MariaDB and Postgres.** Other connections are left alone.
No bindings or values are sent, and neither is the raw plan. What arrives is a summary of it: whether it reads the whole table, which table, how many rows the planner expects, and on MySQL and MariaDB the index it chose and the ones it considered. Postgres plans do not name those, so they arrive empty.
A plan rides on the request it was taken in, so it counts towards nothing on its own.
### Where it shows up
A statement's page shows its newest plan: full scan or not, the table, the estimated rows, the index used or the indexes that exist but were passed over, and when it was explained. A statement whose newest plan is a full scan is marked on the queries list.
### The missing index detector
With plans arriving, LaraBug opens a **Missing index** issue for a statement when all three of these hold:
* its newest plan in the last six hours is a full table scan,
* the planner expects that scan to read at least 10,000 rows,
* and the statement matters: it ran at least 100 times in those six hours, or spent at least a minute of database time.
The issue carries the statement, the table, the estimated rows, and the possible keys when there are any. That last one decides the fix. An index that exists but is not used wants the statement or the index looked at, often a function wrapped around the column or a type mismatch. No index at all wants one created.
It resolves itself when a newer plan shows the statement no longer reads the whole table. More often, a statement that got its index stops being slow, stops being explained, and the issue resolves a few hours after its last plan ages out of the window. The thresholds live in `config/detection.php` under `missing_index` and are set high on purpose until there are plans from real applications to tune them against.
---
Source: https://v4.larabug.com/docs/telemetry/queue-jobs.md
# Queues and jobs
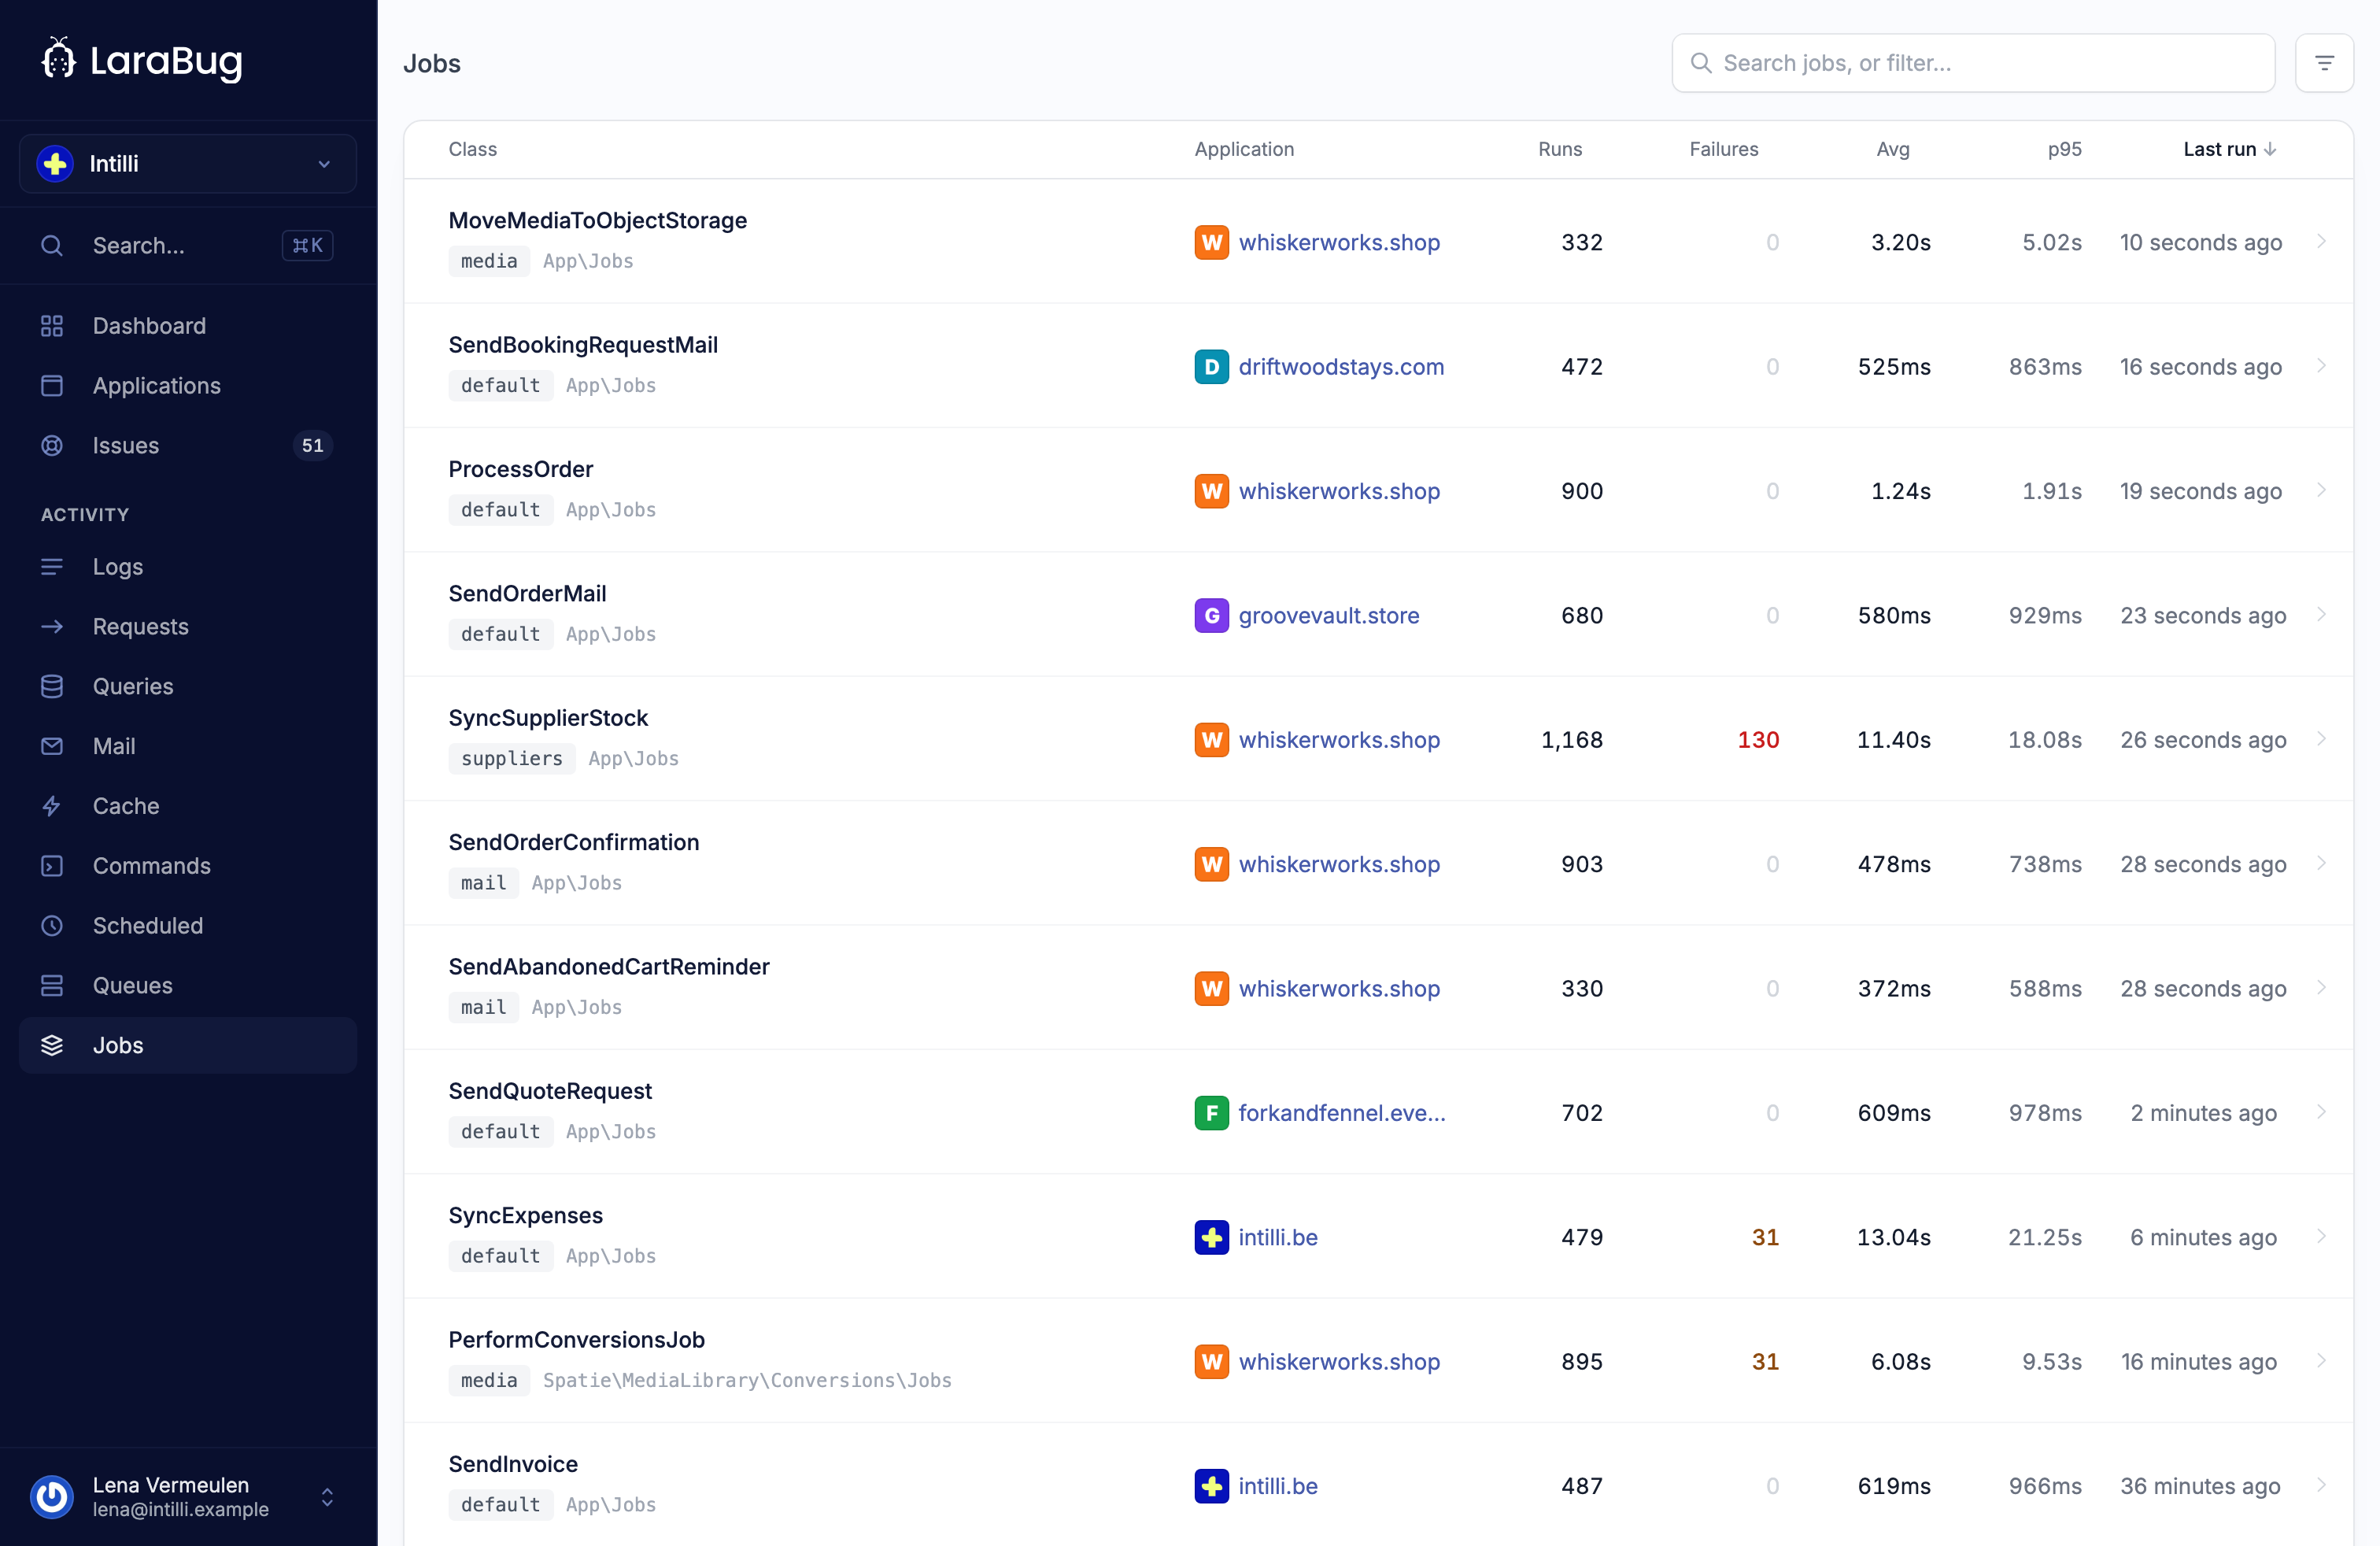
The client reports queue work as well as exceptions, which is what fills the queue pages in the panel: what is waiting, what is running, what failed, and how long a job takes.
## What is tracked
| Key | Environment variable | Default | What it does |
| --- | --- | --- | --- |
| `jobs.track_jobs` | `LB_TRACK_JOBS` | `true` | The switch for all of it. |
| `jobs.track_failed` | `LB_TRACK_FAILED` | `true` | Failed jobs. |
| `jobs.track_completed` | `LB_TRACK_COMPLETED` | `true` | Completed jobs, which is what makes throughput and duration possible. |
| `jobs.track_processing` | `LB_TRACK_PROCESSING` | `false` | A report the moment a job starts. Off by default: it doubles the events for a number you can infer. |
Completed jobs are the expensive ones. On an application that runs a million jobs a month they are a million events, so if you only want to know about failures, turn `track_completed` off and keep `track_failed`.
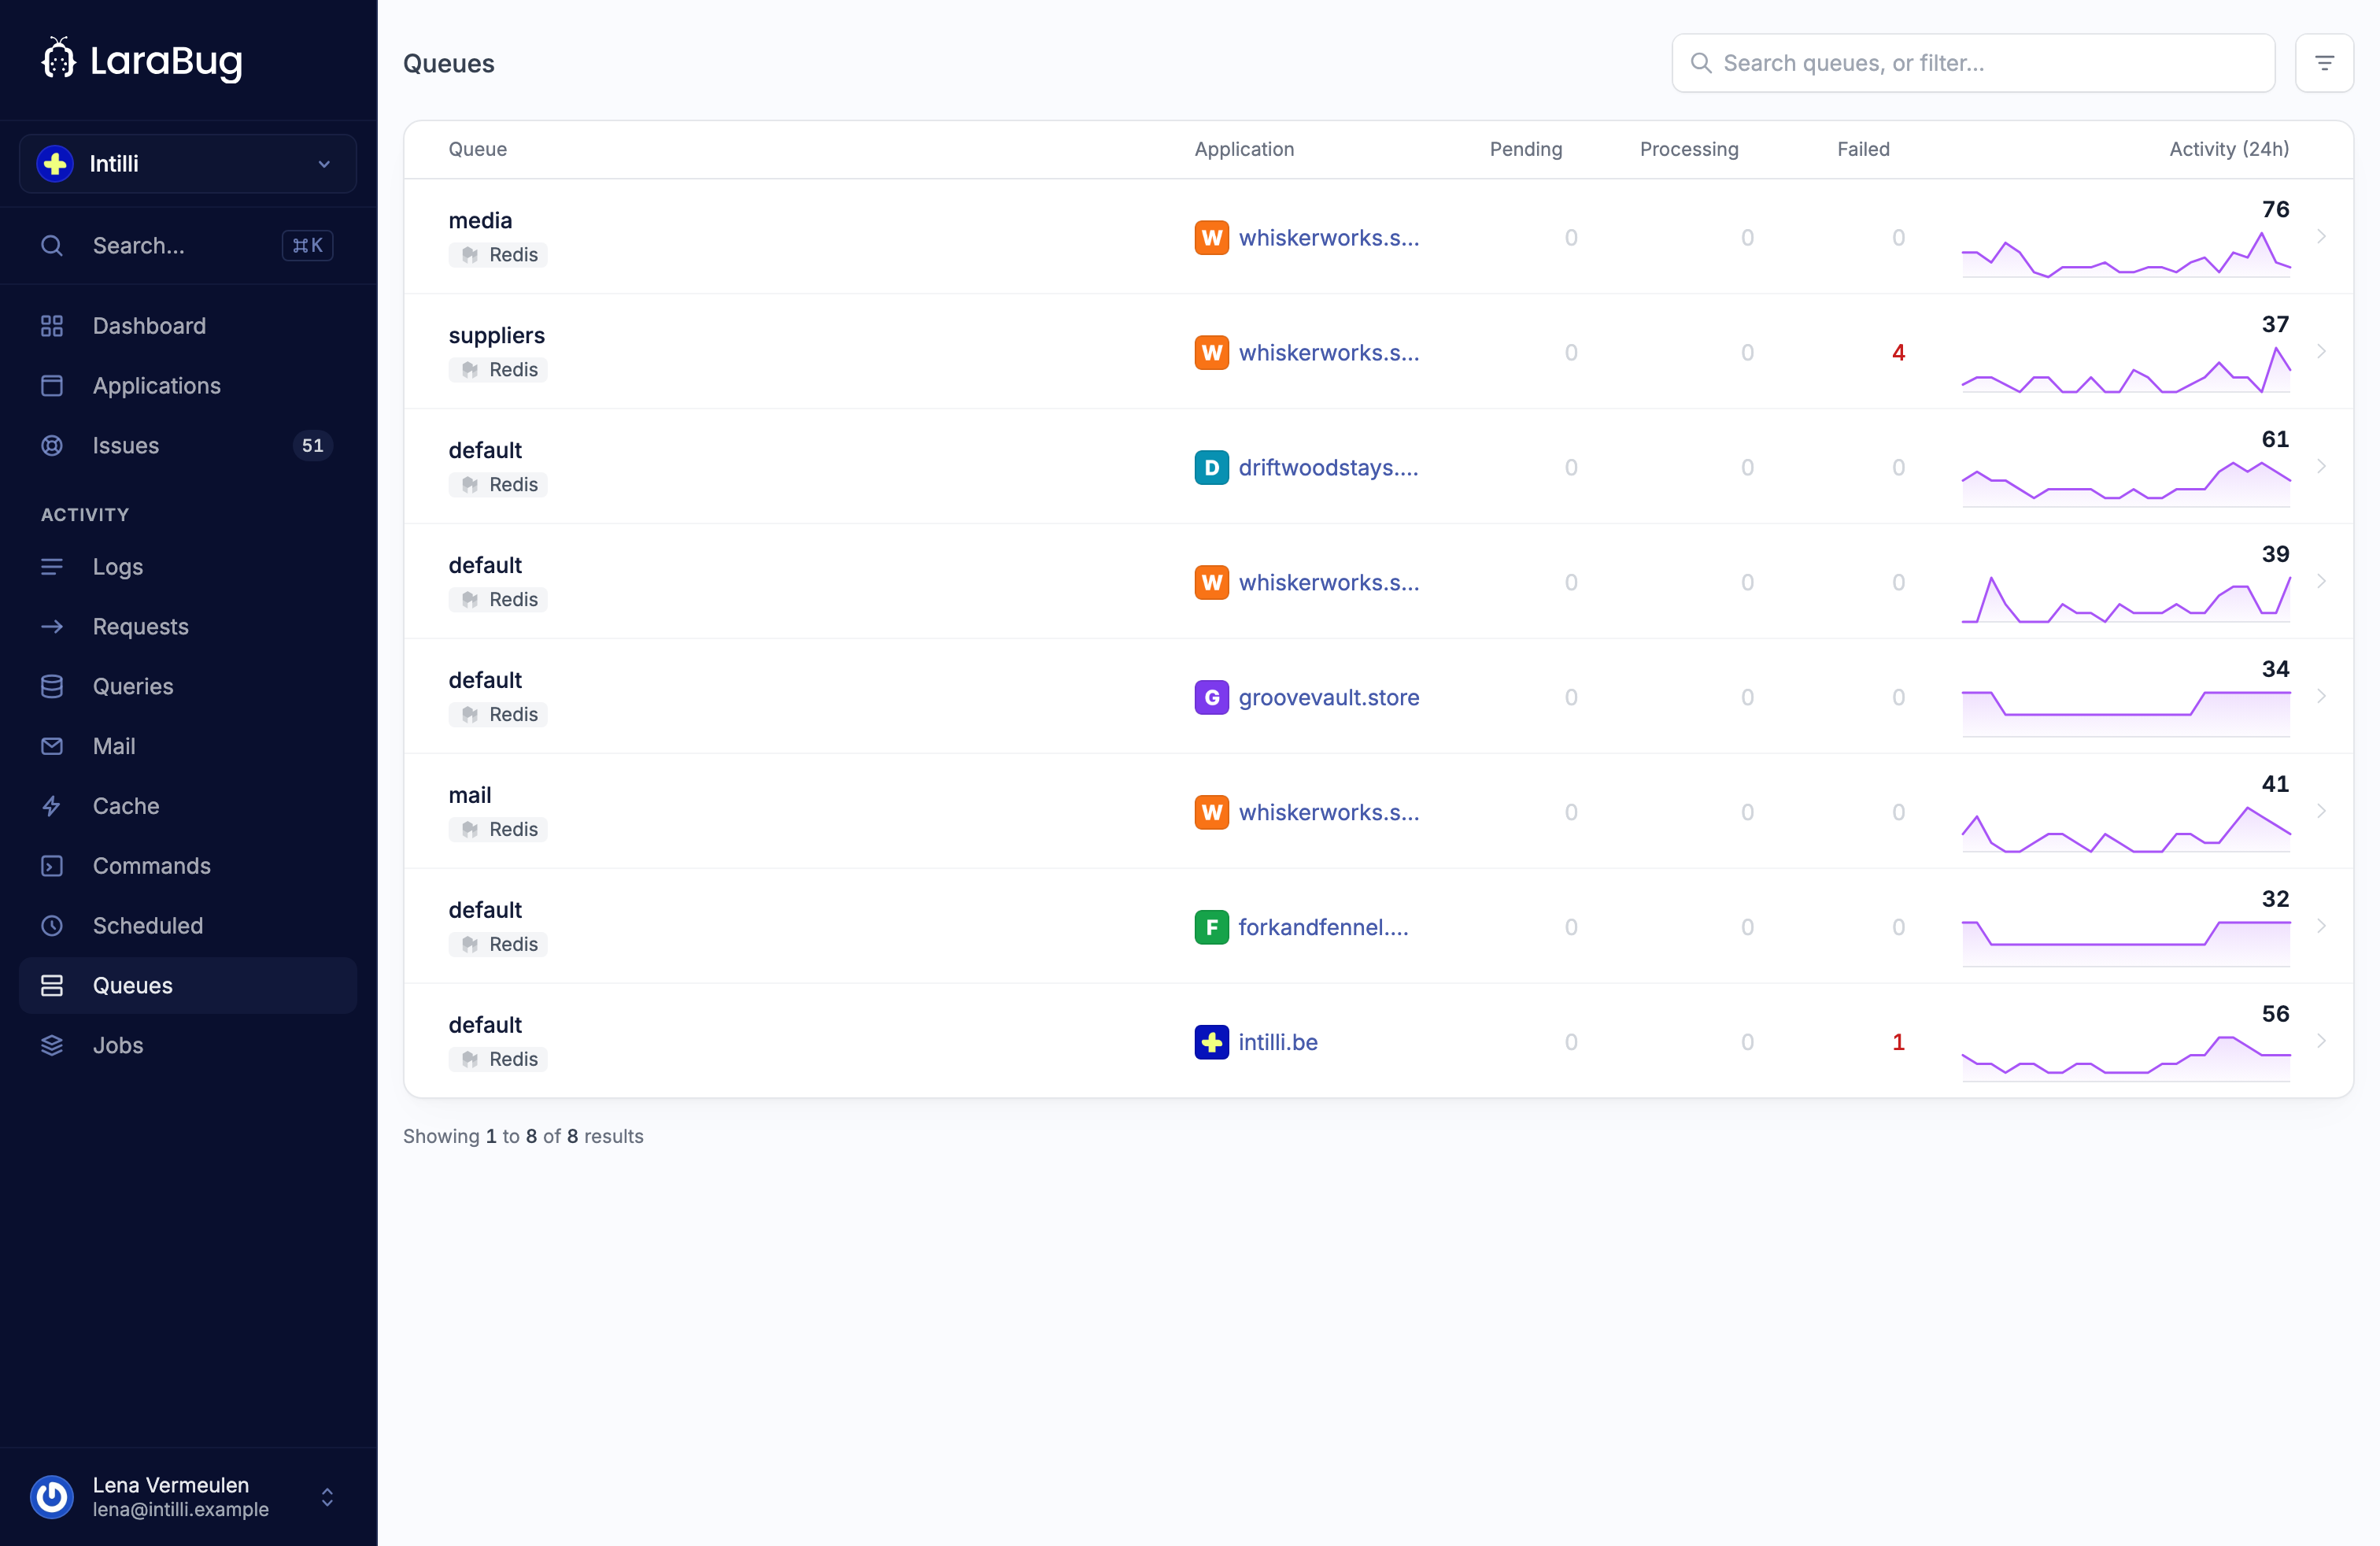
## Choosing which queues
```php config/larabug.php
'only_queues' => array_filter(explode(',', env('LB_ONLY_QUEUES', ''))),
'ignore_queues' => array_filter(explode(',', env('LB_IGNORE_QUEUES', ''))),
'ignore_jobs' => [],
```
`only_queues` is a whitelist and wins where both are set. `ignore_jobs` takes class names, for the one job that runs every minute and tells you nothing.
## Sampling
```php config/larabug.php
'sample_rate' => env('LB_SAMPLE_RATE', 1.0),
```
A rate of `0.1` reports one job in ten. Durations and throughput stay representative, the event count drops by nine tenths, and a failure is still a failure: sampling applies to the volume, not to the thing you are watching for.
## Batching
Reports are batched rather than sent one at a time, and the batch adapts to load.
| Key | Default | What it does |
| --- | --- | --- |
| `batch_size` | `50` | Reports per request. |
| `flush_interval` | `30` | Seconds before a partial batch is sent anyway. |
| `auto_batch_threshold` | `10` | Jobs per second before batching turns itself up. |
| `auto_batch_disable_threshold` | `5` | Jobs per second before it turns itself back down. |
| `auto_batch_cooldown` | `5` | Seconds it waits before doing either. |
| `max_retries` | `3` | Attempts before a batch is dropped. |
| `max_payload_size` | `10000` | Bytes of job payload kept per report. |
The defaults hold on a busy queue. Raise `batch_size` and `flush_interval` together if you would rather trade freshness for fewer requests.
## Tracking one job on purpose
With `track_jobs` off, or where you want a job followed that would otherwise be sampled out:
```php
dispatch_tracked(new GenerateMonthlyInvoices($team));
```
The helper sets `trackInLaraBug` on the job and dispatches it, which you can also do yourself:
```php
$job = new GenerateMonthlyInvoices($team);
$job->trackInLaraBug = true;
dispatch($job);
```
## The client's own errors
```php config/larabug.php
'report_sdk_errors' => env('LB_REPORT_SDK_ERRORS', false),
'report_buffer_errors' => env('LB_REPORT_BUFFER_ERRORS', false),
```
Both off by default. Turn them on while you are debugging why nothing is arriving, and off again afterwards: a client that reports its own failures to the service it cannot reach is a loop you do not want on a bad day.
---
Source: https://v4.larabug.com/docs/telemetry/scheduled-tasks.md
# Scheduled tasks
A scheduled task event is one run of one entry in your schedule: what ran, how long it took, and how it ended.
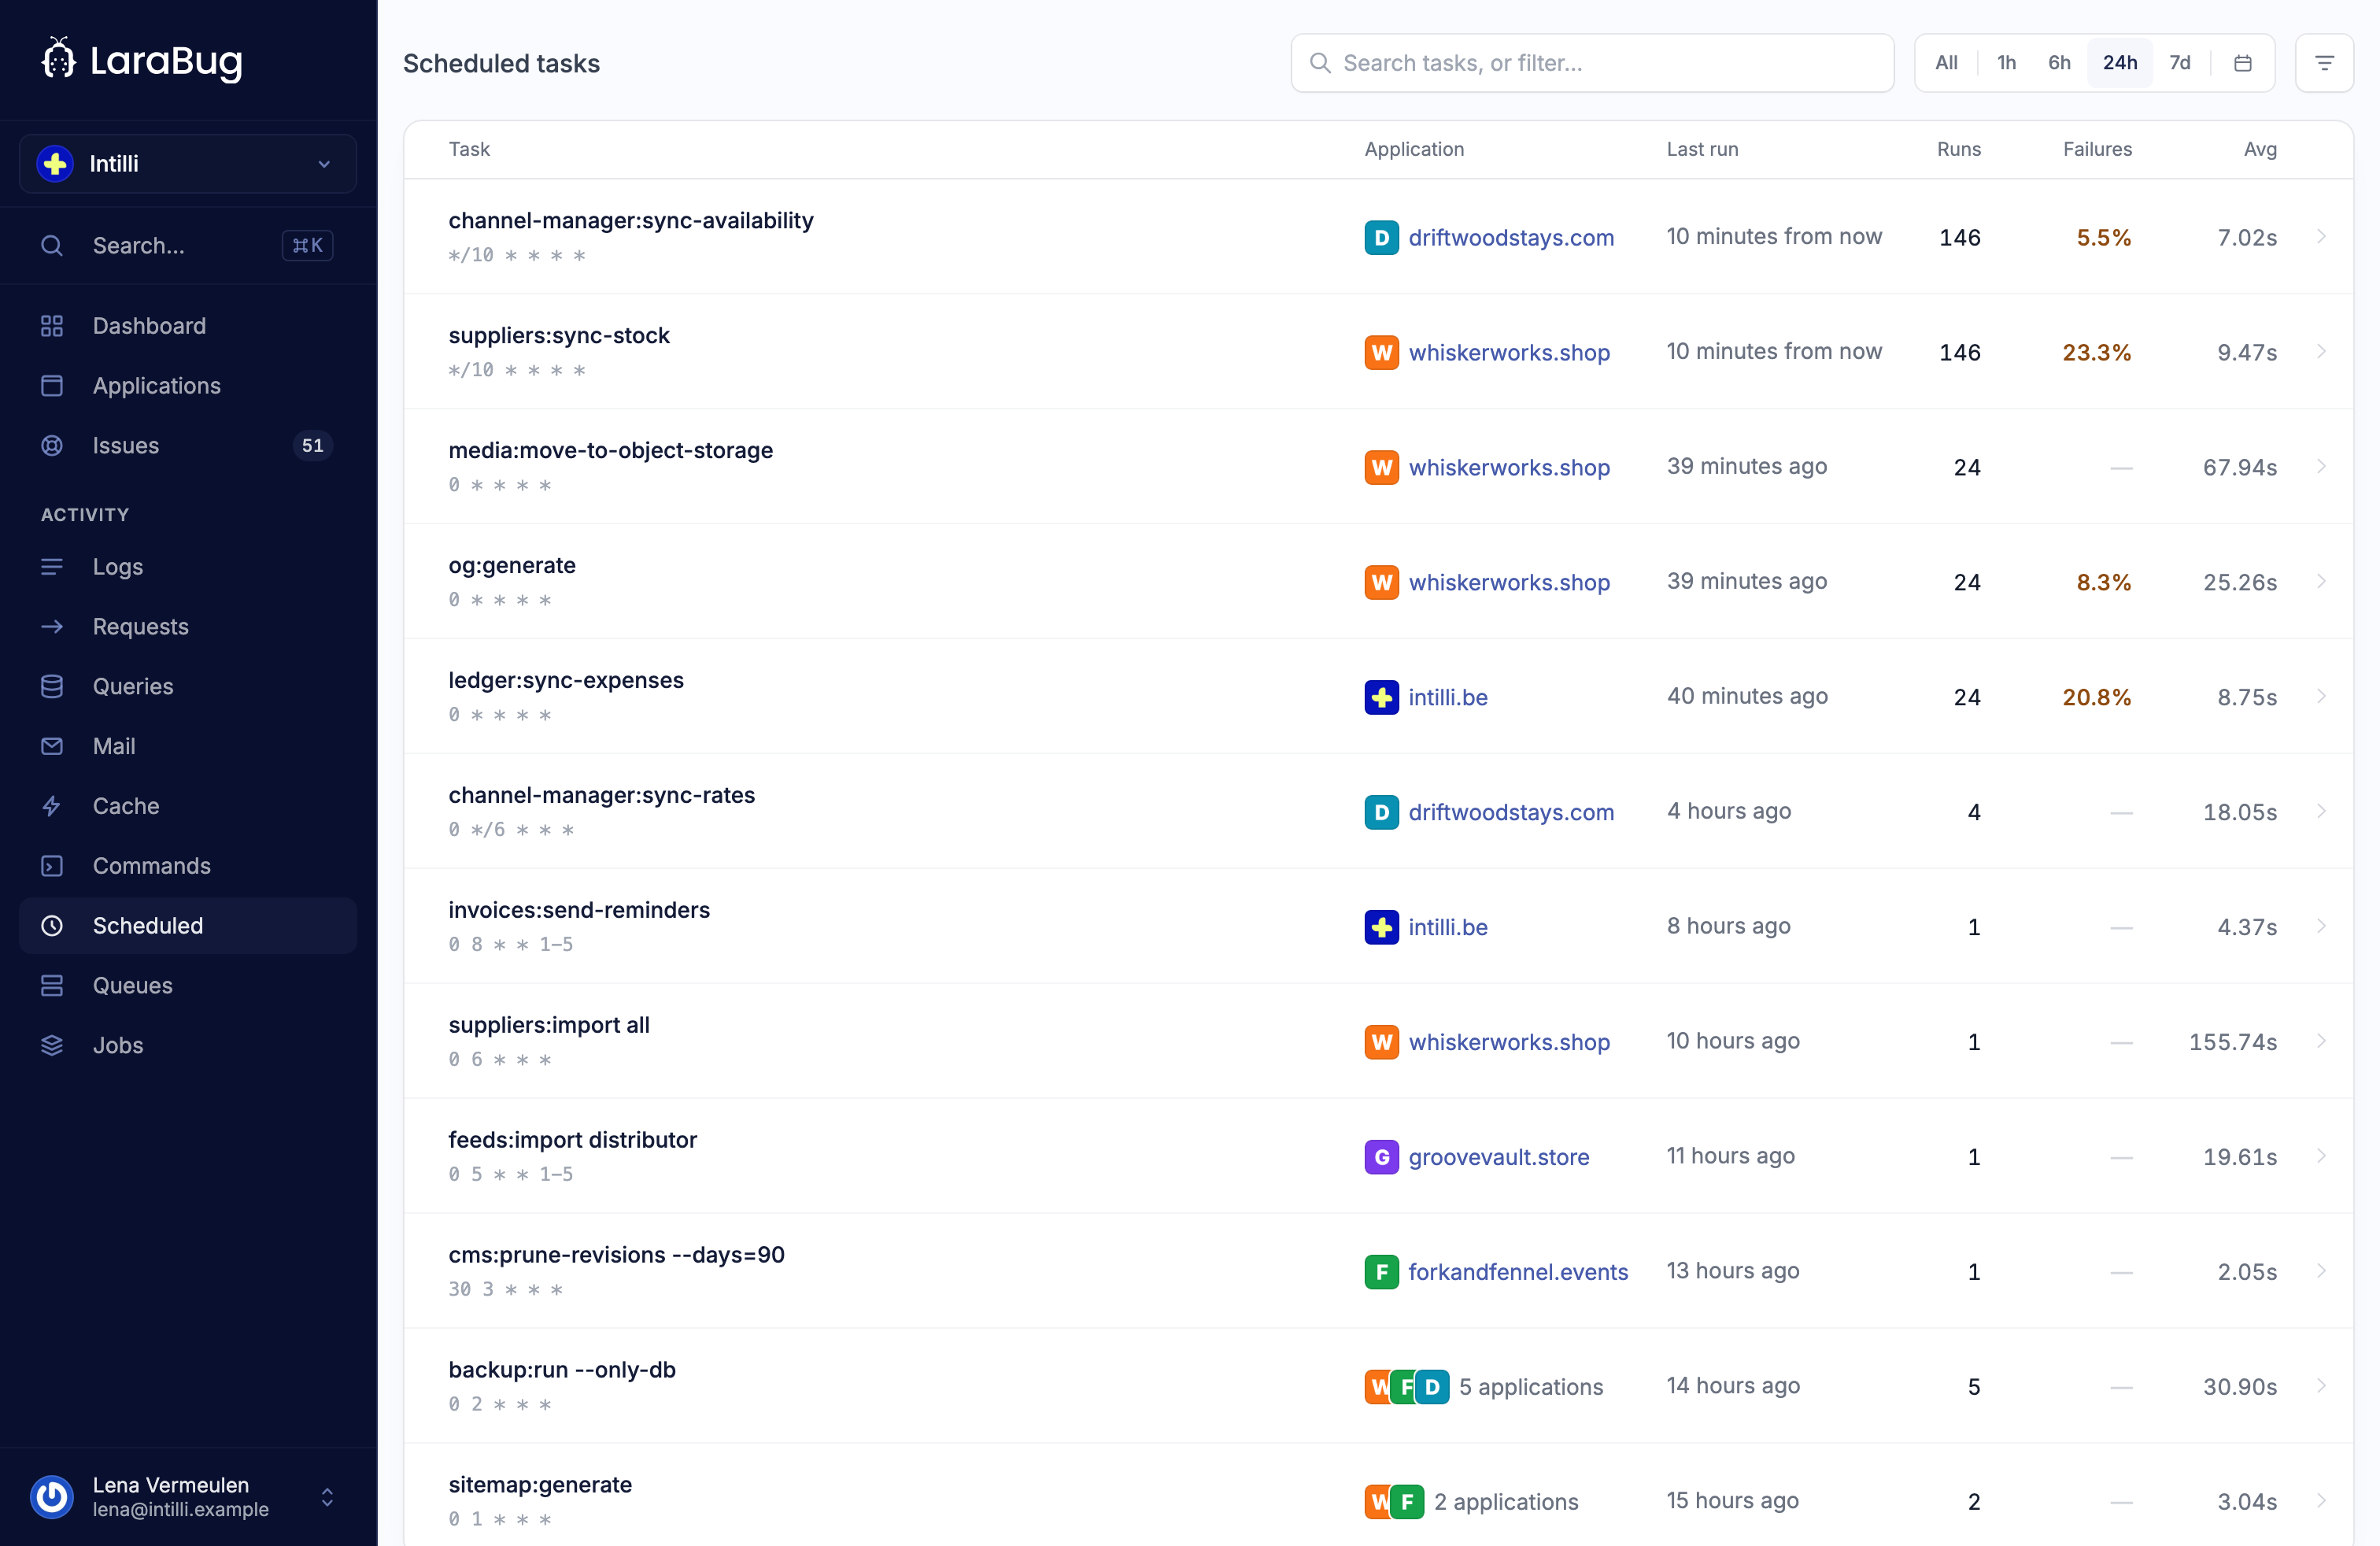
## Turning it on
```env .env
LB_TRACK_SCHEDULED_TASKS=true
```
Then accept **Scheduled tasks** on the application.
This needs the scheduler itself to be running, which is the one line of cron Laravel asks for:
```bash crontab
* * * * * cd /path-to-your-project && php artisan schedule:run >> /dev/null 2>&1
```
## What is recorded
| Field | What it is |
| --- | --- |
| Task | The command, or the description of a closure. |
| Expression | The cron expression it is scheduled on. |
| Status | Finished, failed or skipped. |
| Duration | How long the run took. |
| Without overlapping | Whether the task is guarded against running twice. |
| Host | Which machine ran it, which matters when more than one could have. |
A skipped run is a run: a task guarded by `withoutOverlapping` that skips every minute for an hour is a task whose previous run never finished.
## The task that stopped
The point of recording a schedule is not the run you can see. It is the run you cannot: a task that quietly stopped firing looks exactly like a task nobody has looked at. In the panel, a task that has missed its window is flagged against its own expression rather than against a threshold you have to pick.
## Commands and the schedule
A scheduled command fires Laravel's command events too. It is counted once, against the schedule, not twice. [Commands](/docs/telemetry/commands) covers the runs that are not scheduled.
## Batching
`schedule.batch_size` is twenty, `schedule.max_retries` is two. A scheduler that runs every minute rarely fills a batch, so most runs are sent as they finish.
---
Source: https://v4.larabug.com/docs/telemetry/commands.md
# Commands
An Artisan command that ran: which one, with which arguments, how long it took and what it exited with.
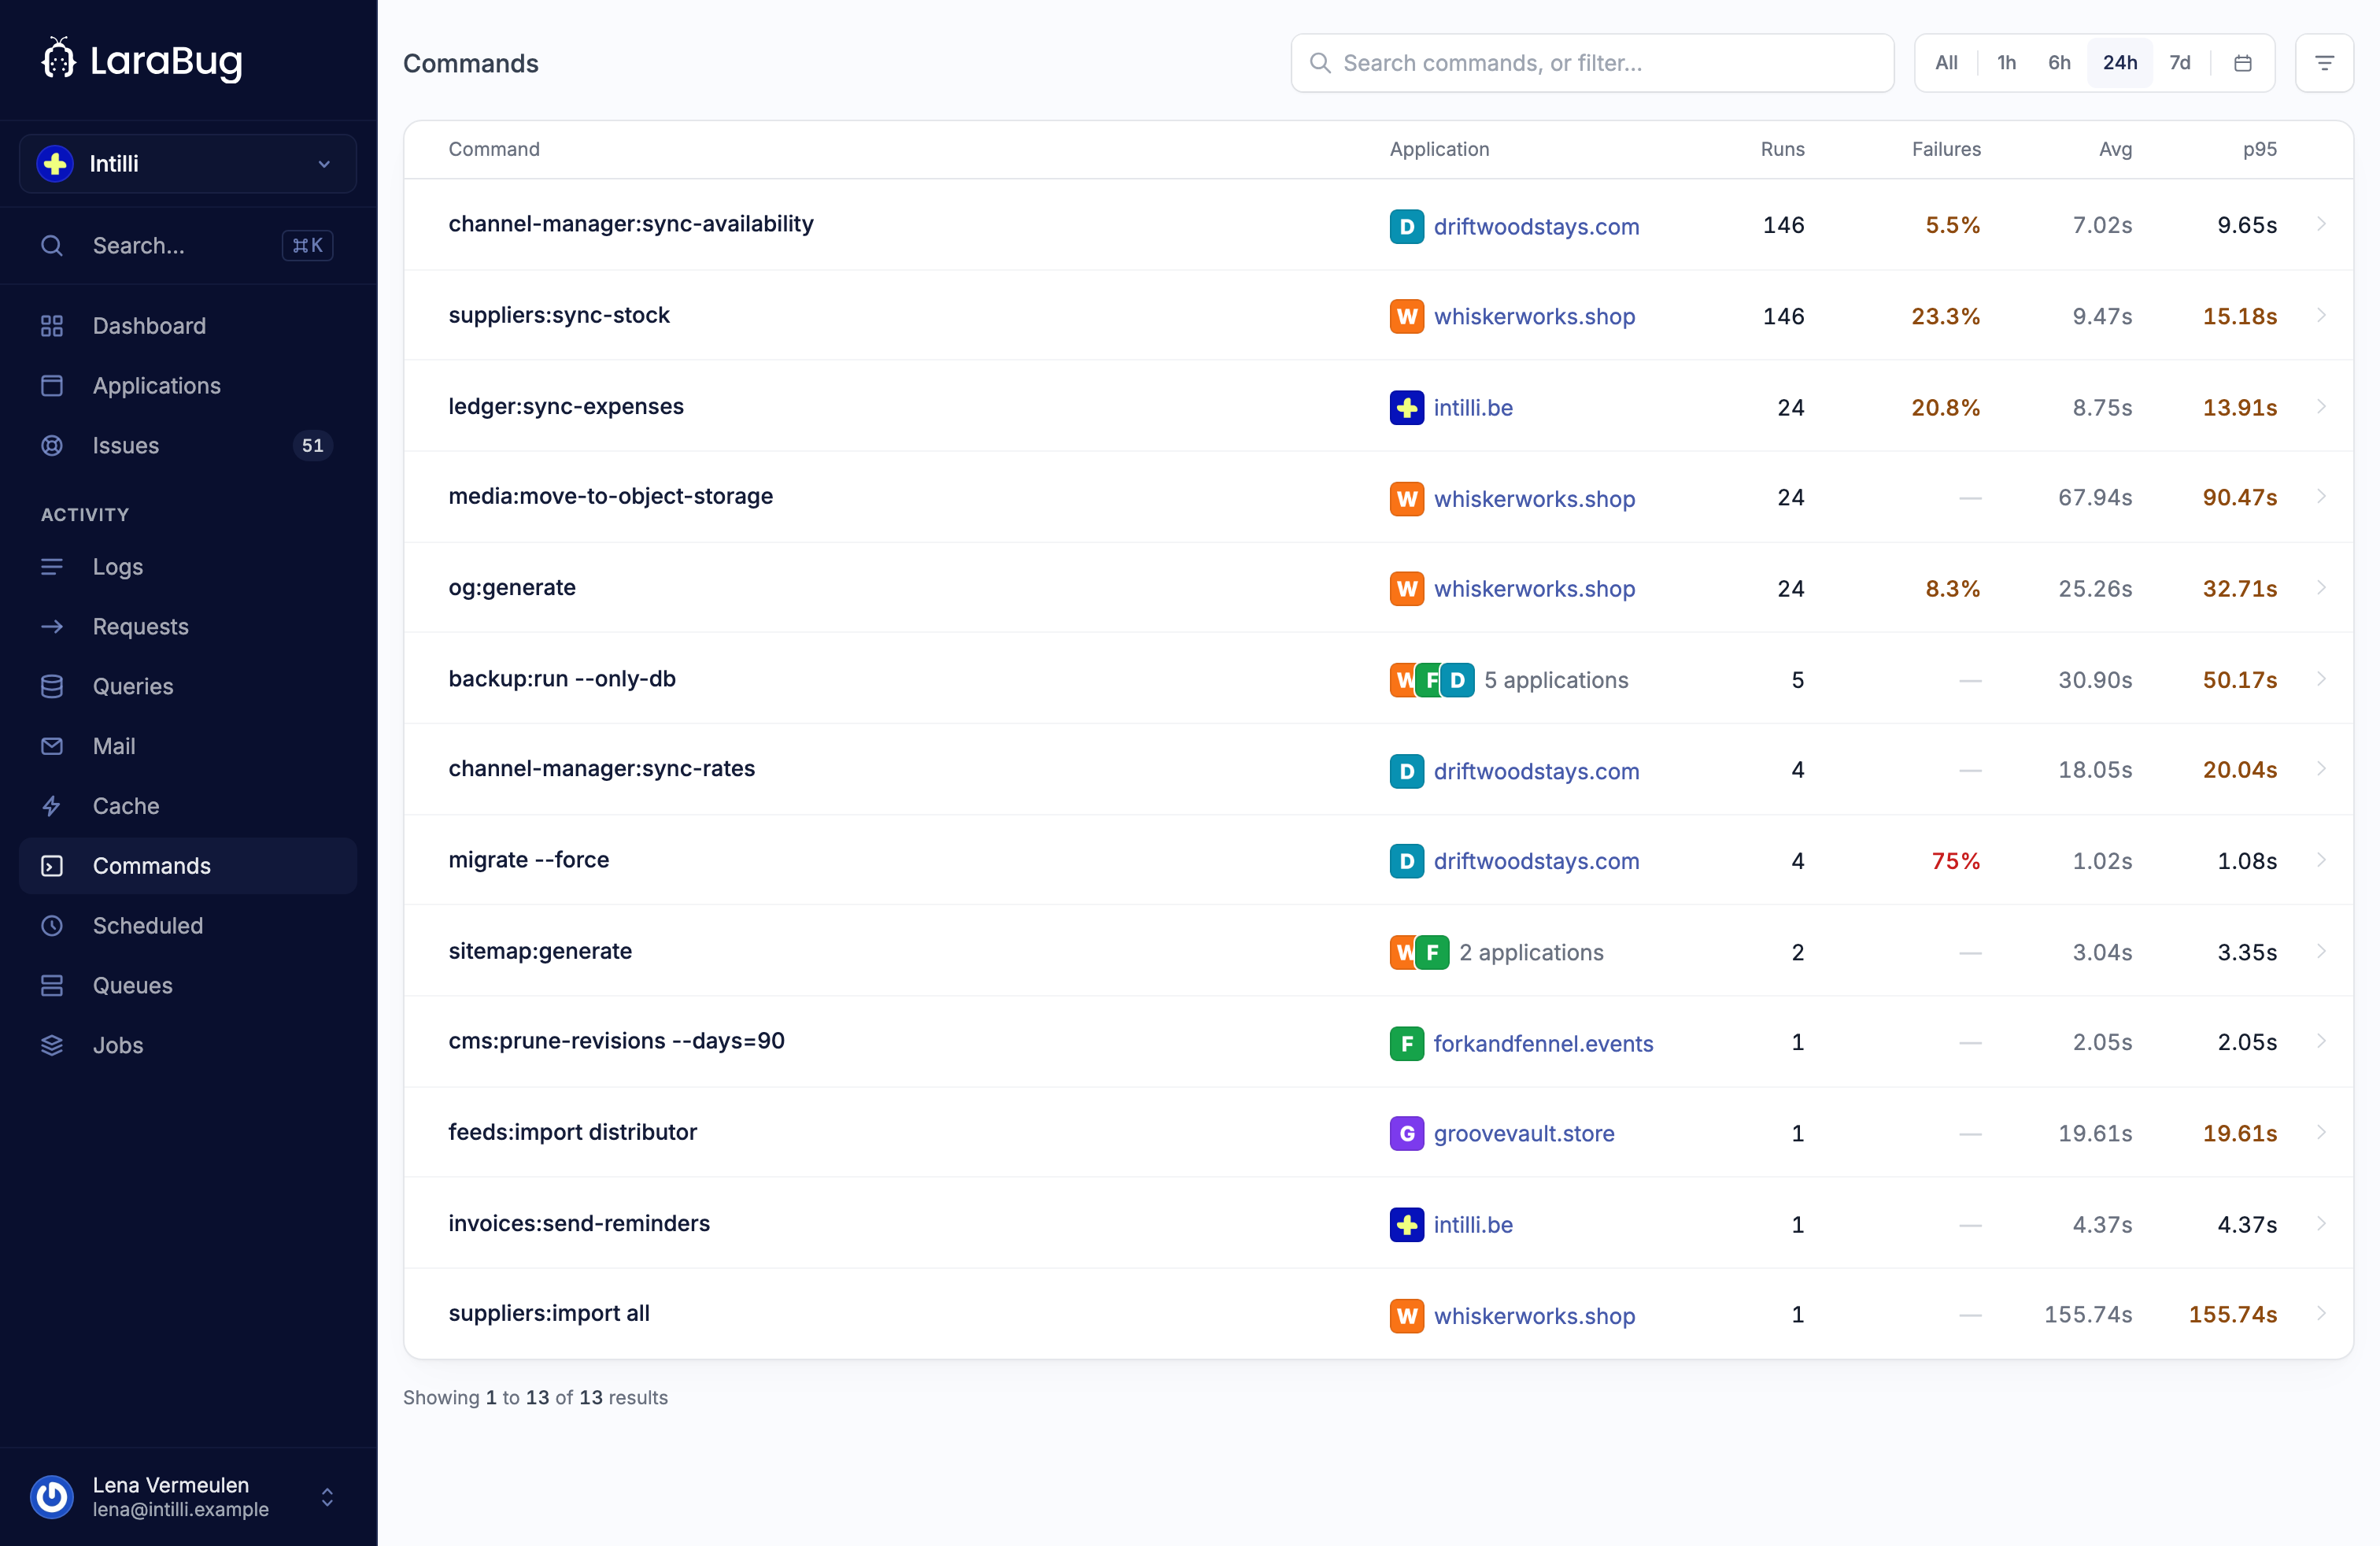
## Turning it on
```env .env
LB_TRACK_COMMANDS=true
```
Then accept **Commands** on the application.
## What is ignored
```php config/larabug.php
'ignore' => [
'schedule:run',
'schedule:finish',
'schedule:work',
'queue:work',
'queue:listen',
'horizon',
'horizon:*',
'larabug:*',
'list',
'tinker',
],
```
The plumbing. A `queue:work` that runs for a week is one command run, and it would tell you nothing that the [queue jobs](/docs/telemetry/queue-jobs) it processed do not. `*` is the only wildcard.
A command run by the scheduler is left to the schedule, so it is recorded once, as a [scheduled task](/docs/telemetry/scheduled-tasks), rather than twice.
## What is recorded
The command and its arguments, the exit code, the duration, the peak memory, the host it ran on, and the trace id, which is what ties a command to the logs and exceptions it produced.
## Arguments
```php config/larabug.php
'redact' => [
'password',
'secret',
'token',
'key',
],
```
Arguments and options are recorded, because `php artisan users:export --since=2026-01-01` is a different event from `php artisan users:export`. Any option whose name contains one of these words has its value replaced before the event is built.
## Batching
`commands.batch_size` is twenty and `commands.max_retries` is two. A command that runs for hours reports when it exits, not while it runs.
---
Source: https://v4.larabug.com/docs/telemetry/logs.md
# Logs
Your application's log records, in the panel, beside the exceptions and requests they belong to.
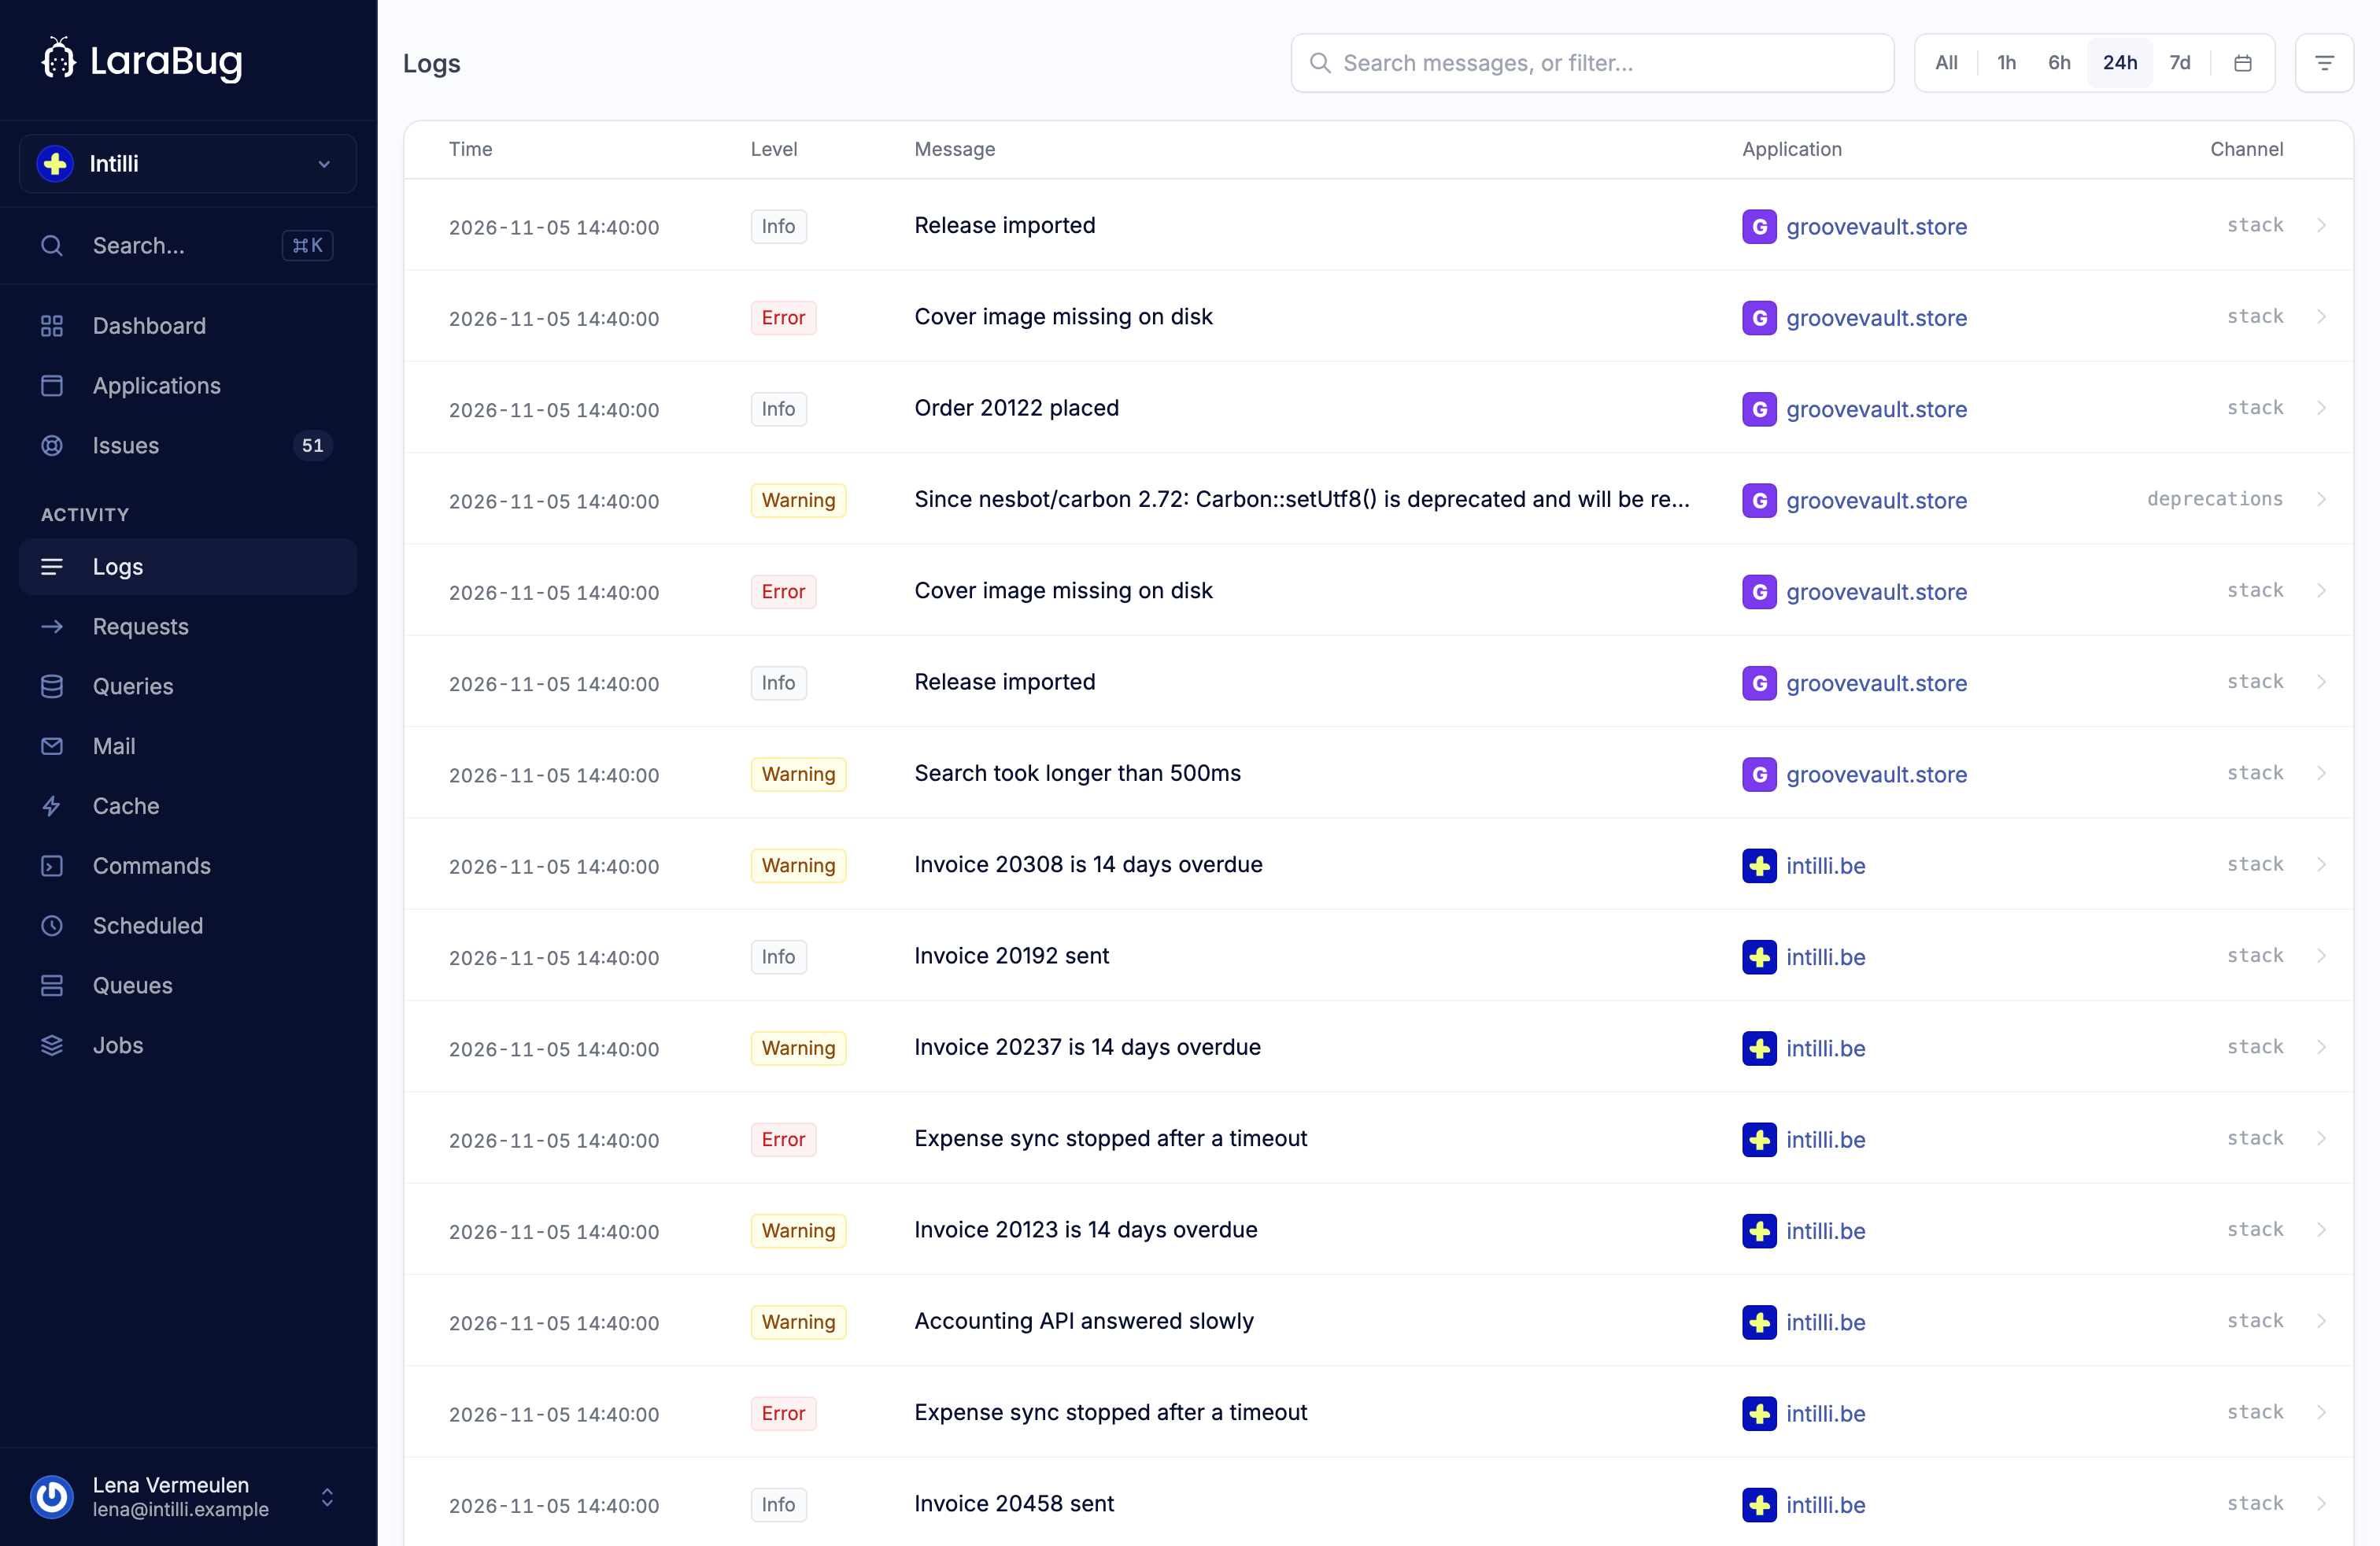
## Turning it on
Two things: the channel, and the application feature.
```php config/logging.php
'channels' => [
'stack' => [
'driver' => 'stack',
'channels' => ['single', 'larabug', 'larabug-logs'],
'ignore_exceptions' => false,
],
'larabug-logs' => [
'driver' => 'larabug-logs',
'level' => 'info',
],
],
```
Then accept **Logs** on the application.
## The two channels are different things
| Channel | What it does |
| --- | --- |
| `larabug` | Reports a log record as an exception. This is the channel in [installation](/docs/laravel/installation), and it is how `Log::error()` becomes an issue. |
| `larabug-logs` | Ships log records as log records: buffered, batched, and readable as a stream. |
Most applications want both. They answer different questions, and neither is a replacement for the other.
## The level
```php config/larabug.php
'logs' => [
'level' => env('LB_LOGS_LEVEL', 'info'),
],
```
`info` and up by default. The channel's own `level` wins over this one, which is what lets a stack write everything to disk and ship only warnings to LaraBug.
Debug is a level, not a plan. An application at `debug` in production will spend its allowance on log lines rather than on the errors it took them to explain.
## What is sent
The timestamp, the level, the channel, the message, the context and Monolog's extra, the environment and the release.
Plus the three things that make a line worth having: the trace id, so the record sits with the request or job that wrote it; the exception id, when the record was written alongside one; and the user identifier, when there is one.
An `exception` key in the context is dropped before sending. It is the largest thing in the payload, and it arrives properly as an [exception](/docs/issues/exceptions) through the other channel.
## Context
```php config/larabug.php
'max_context_keys' => env('LB_LOGS_MAX_CONTEXT_KEYS', 50),
```
Context is sent as given, so the rule is the one from [filtering sensitive data](/docs/guides/filtering-sensitive-data): what you put in a log line is what gets stored. Objects are reduced to their class name rather than serialised, and long values are truncated.
## Batching
`logs.batch_size` is fifty, `logs.max_retries` is three, and the buffer is flushed when the application terminates. A request that logs forty lines makes one call, not forty.
## Deprecations
Laravel throws its deprecation warnings away unless you tell it otherwise: `logging.deprecations` points at the `null` channel. Clients newer than 4.0.0-beta.12 add LaraBug to that channel themselves, next to wherever you already send them, and `logs.deprecations` in `config/larabug.php` turns it off.
They arrive as warnings on the `deprecations` channel, so **Logs** has to be accepted on the application. A deprecation fires on every call, so the client sends each one the first time it happens in a process and then at most once an interval, with a count of how many times it happened in between. Each record carries the file and line it was raised at and whether PHP or Laravel raised it.
LaraBug opens one issue per deprecation, at low priority, the first time it sees one. A deprecation is a file, a line and a message with its values taken out, so "Implicit conversion from float 6360.07 to int" and the same line with another float are one issue, titled with `{n}` where the number was, and the issue quotes one of the messages as it arrived. The issue names the message, the file and line, how many times it happened over the last day, and when it was first and last seen. It also says whether the file is yours or under `vendor/`: a deprecation in your code is fixed by changing that line, and one in a package by upgrading the package.
The issue resolves itself once the deprecation has not been seen for seven days. Older clients send no deprecations, and nothing is opened for them.
---
Source: https://v4.larabug.com/docs/telemetry/mail-and-notifications.md
# Mail and notifications
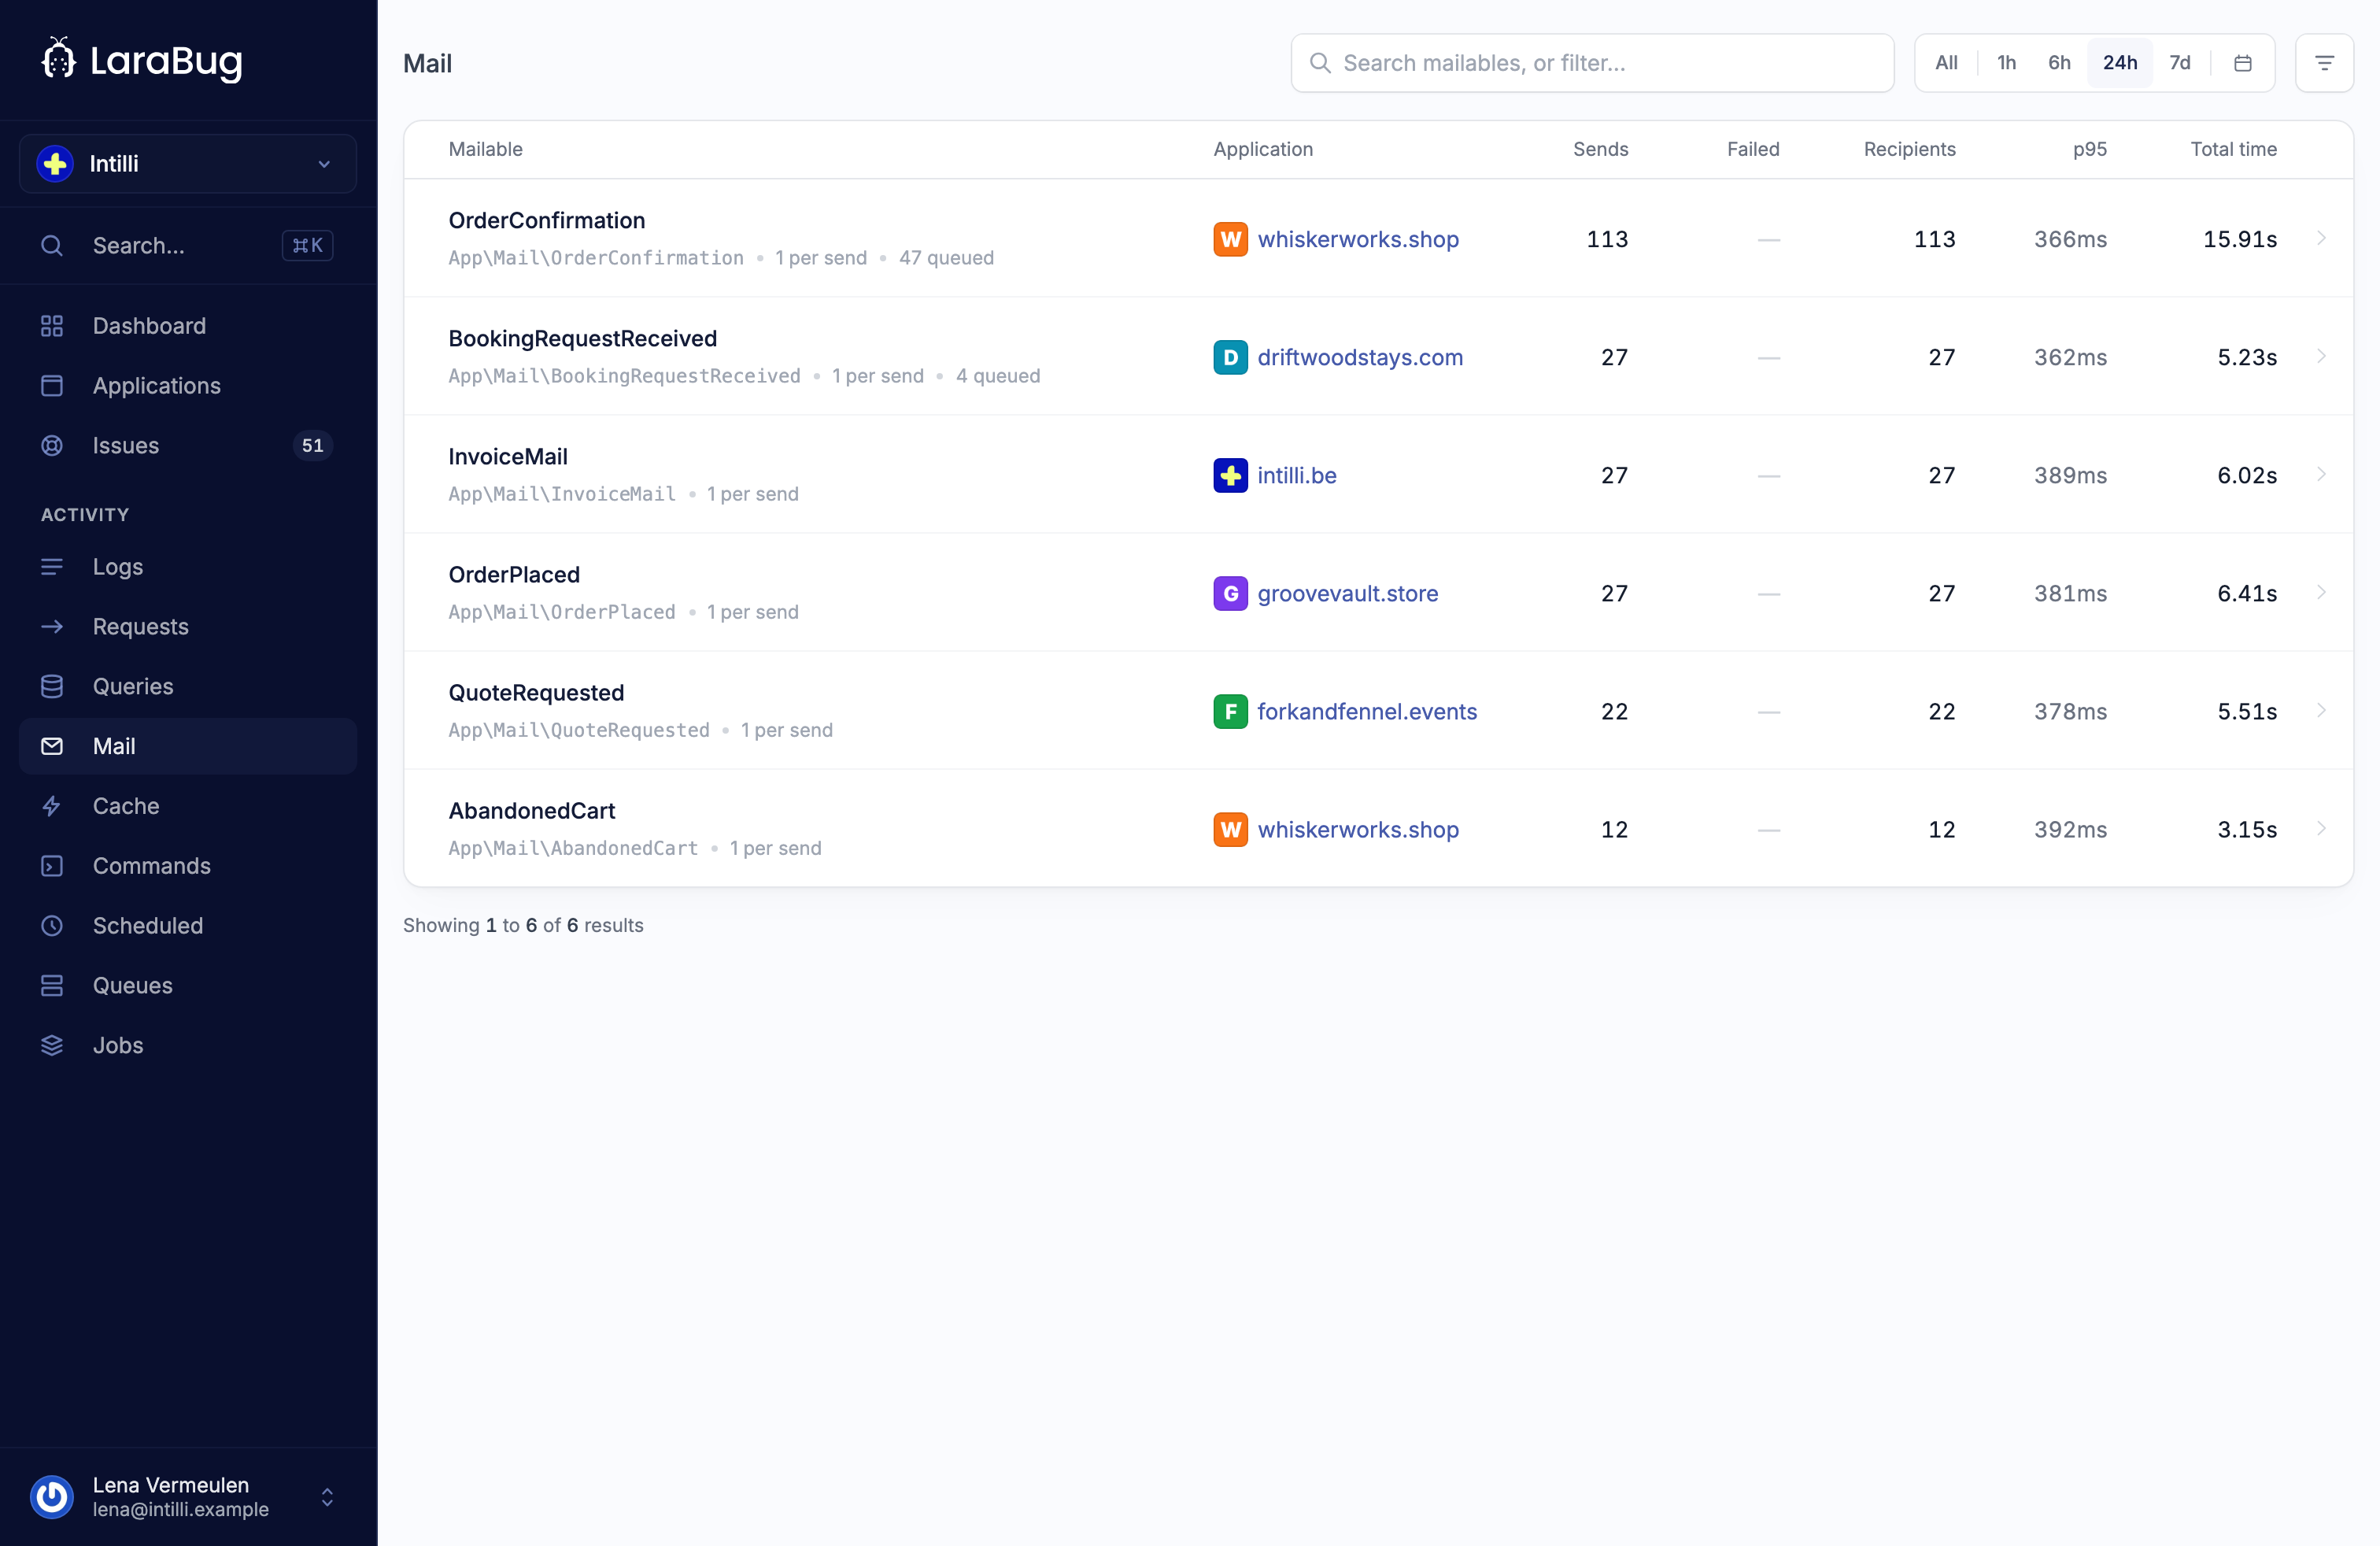
What your application sent, from inside the request that sent it.
## What turns it on
Both are collected as part of a [request](/docs/telemetry/requests), so `requests.track_requests` is the switch and the application has to accept **Requests**.
## Mail
Recorded per message: the mailable class, the subject, how many recipients were on the To, Cc and Bcc, and how long the send took.
Recipients are stored as the domains a message reached, deduplicated, and not as addresses. A bounce is a bounce to `gmail.com` rather than to a person, and the local part is exactly the customer data this is careful not to hold.
```php config/larabug.php
'capture_mail_recipients' => env('LB_REQUEST_CAPTURE_MAIL_RECIPIENTS', false),
```
Turn it on and the full addresses are kept instead. Know what you are turning on before you do.
## Notifications
Recorded per notification: the class, the channel it went out on, the type of the notifiable, and whether it succeeded or failed. The notifiable's id is not recorded: the class is diagnostic, the id is who got notified.
A failed notification is its own record rather than a missing one, which is what makes "the Slack notifications stopped going out on Tuesday" answerable.
## Mail sent by a notification
A notification on the mail channel fires Laravel's mail events as well. It is recorded once, as a notification, rather than once as each.
## Limits
`max_mail` and `max_notifications` are fifty apiece per request. The counters keep counting past that: a request that sent five hundred emails still says five hundred, and that request is worth a look.
---
Source: https://v4.larabug.com/docs/telemetry/cache.md
# Cache
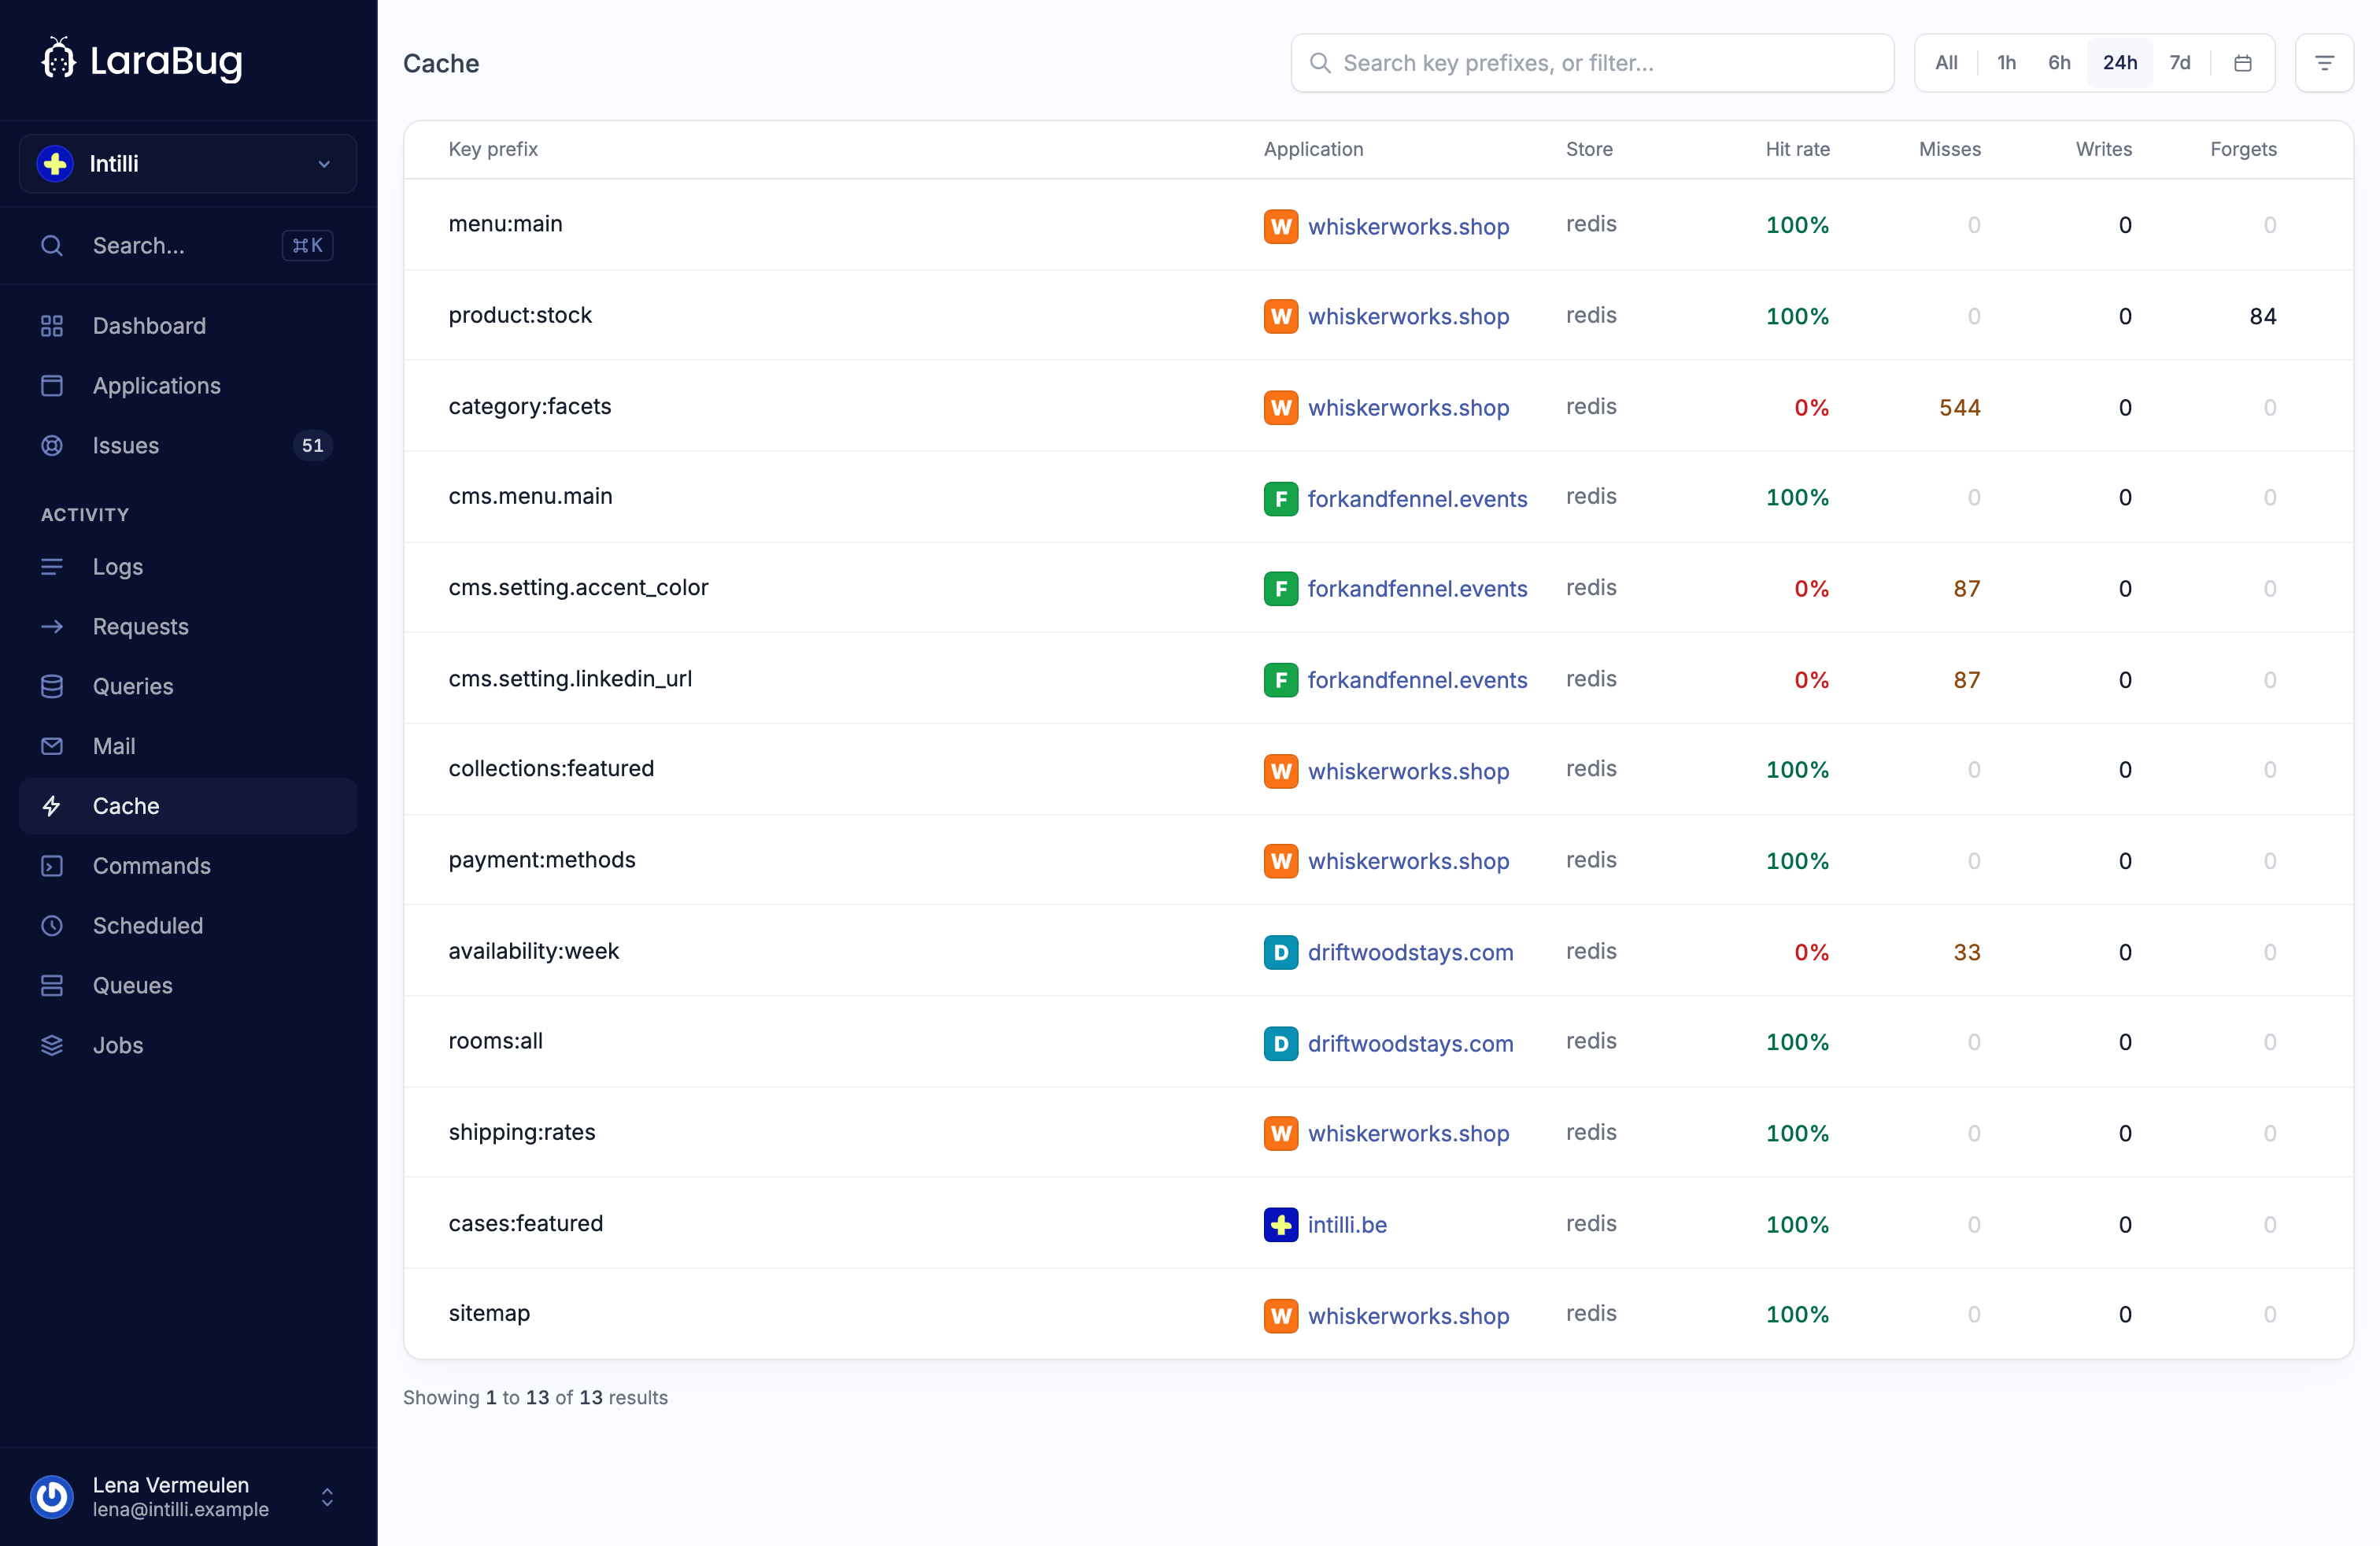
Every cache operation a recorded request performed: what it asked for, whether it was there, and what it wrote.
## What turns it on
Cache operations are collected inside a [request](/docs/telemetry/requests), so `requests.track_requests` is the switch and the application has to accept **Requests**.
## What is recorded
| Field | What it is |
| --- | --- |
| Operation | Hit, miss, write or forget. |
| Store | Which cache store it went to. |
| Key prefix | The part of the key before the first colon. |
| TTL | On a write, how long it was written for. |
## Keys are cut at the colon
Laravel's keys are routinely `prefix:id`, and those two halves are different things: the prefix is the diagnostic part, the id is who the row belongs to. What is stored is the part up to the first colon, and a key with no colon is truncated.
```php config/larabug.php
'capture_cache_keys' => env('LB_REQUEST_CAPTURE_CACHE_KEYS', false),
```
Turn it on to keep whole keys, up to 255 characters, when the id is the thing you are chasing.
## What it answers
A hit ratio is only interesting per endpoint. A page that misses the same key on every request has a cache that is not working, and reading that against the same request's [queries](/docs/telemetry/queries) is usually the whole diagnosis: the misses and the query they cause are in the same waterfall.
`max_cache_events` keeps a hundred operations per request, with the counters running past it.
---
Source: https://v4.larabug.com/docs/javascript/installation.md
# Installing the JavaScript client
There is a package per stack. Install the one that matches yours; they all sit on the same core and take the same options.
```bash
# Vanilla JavaScript or TypeScript
npm install @larabug/browser
# React
npm install @larabug/react
# Vue 3
npm install @larabug/vue
# Inertia, alongside @larabug/vue or @larabug/react
npm install @larabug/inertia
```
## Start it once
Call `init` as early as your bundle runs, before the code that might throw:
```js resources/js/app.js
import { init } from '@larabug/browser'
init({
dsn: import.meta.env.VITE_LARABUG_DSN,
environment: import.meta.env.MODE,
release: import.meta.env.VITE_APP_VERSION,
})
```
Or with the two keys instead of a DSN:
```js resources/js/app.js
init({
login_key: import.meta.env.VITE_LARABUG_LOGIN_KEY,
project_key: import.meta.env.VITE_LARABUG_PROJECT_KEY,
})
```
Both values ship inside the bundle. That is expected: between them they say where a report is filed and that it may be filed, and neither reads anything back. Restrict where they are accepted from with the allowed origins on the application's settings page.
## Options
| Option | Default | What it does |
| --- | --- | --- |
| `dsn` | none | Both keys and the endpoint in one string. Wins over the pair. |
| `login_key`, `project_key` | none | The ingest key and the project key, if you would rather not use a DSN. |
| `environment` | none | Reported with every event. |
| `release` | none | The build the error came from. |
| `enabled` | `true` | Set it to `false` and the client reports nothing. |
| `sampleRate` | `1.0` | Report this share of events. |
| `maxEventsPerMinute` | `100` | A hard ceiling. Anything over it is dropped, not queued. |
| `dedupeWindowMs` | `5000` | Two identical events inside this window count as one. |
| `maxBreadcrumbs` | see the package | How much of what happened before the error is kept. |
| `blacklist` | see below | Extra object keys to scrub. |
| `urlBlacklist` | see below | Extra query parameters to strip from URLs. |
| `beforeSend` | none | Your last word on every event. |
| `user`, `context` | none | Attached to everything the client sends. |
`maxEventsPerMinute` is the one to know about. A render loop that throws can produce thousands of identical errors a second, and a browser client with no ceiling turns that into your whole monthly allowance.
## Next
* [Vanilla JavaScript](/docs/javascript/vanilla-javascript) for the plain setup and reporting by hand.
* [React](/docs/javascript/react), [Vue 3](/docs/javascript/vue-3) or [Inertia](/docs/javascript/inertia) for the framework bindings.
* [Filtering sensitive data](/docs/guides/filtering-sensitive-data), which matters more in a browser than on a server.
---
Source: https://v4.larabug.com/docs/javascript/vanilla-javascript.md
# Vanilla JavaScript
`@larabug/browser` is the client every other package is built on. Use it directly for an application with no framework, or with one that has no binding of its own.
## Start it
```js
import { init } from '@larabug/browser'
init({
dsn: import.meta.env.VITE_LARABUG_DSN,
environment: import.meta.env.MODE,
})
```
From that point uncaught errors and unhandled promise rejections are reported on their own.
## Reporting something yourself
```js
import { captureException, captureMessage } from '@larabug/browser'
try {
await checkout(cart)
} catch (error) {
captureException(error, { cart_id: cart.id, step: 'payment' })
showFailureNotice()
}
```
The second argument is your context. It arrives beside the error, and it is the difference between "TypeError in checkout" and "TypeError in checkout, cart 4471, at the payment step".
For something that is worth knowing but is not an error:
```js
captureMessage('Payment provider took longer than 10s', 'warning')
```
The level is `error`, `warning` or `info`.
## Who it happened to
```js
init({
dsn: import.meta.env.VITE_LARABUG_DSN,
user: { id: currentUser.id, plan: currentUser.plan },
})
```
An id and the one or two attributes that change how the application behaves. Not an email address: see [filtering sensitive data](/docs/guides/filtering-sensitive-data).
## Reaching the client later
```js
import { getCurrentClient } from '@larabug/browser'
getCurrentClient()?.captureException(error)
```
`init` returns the same client, so keep the return value if that is easier than asking for it again.
---
Source: https://v4.larabug.com/docs/javascript/react.md
# React
`@larabug/react` is the browser client plus an error boundary and three hooks. Everything in [vanilla JavaScript](/docs/javascript/vanilla-javascript) applies here too.
## Start it
```jsx
import { init } from '@larabug/react'
init({
dsn: import.meta.env.VITE_LARABUG_DSN,
environment: import.meta.env.MODE,
})
```
## Catch what React swallows
An error thrown while rendering does not reach `window.onerror`: React catches it and unmounts the tree. The boundary is how it gets reported.
```jsx
import { ErrorBoundary } from '@larabug/react'
export default function App() {
return (
}>
)
}
```
Put one high enough to catch anything, and put another around a widget that is allowed to fail without taking the page with it.
## The hooks
```jsx
import { useLaraBugUser, useLaraBugContext, useLaraBugTag } from '@larabug/react'
function Dashboard({ user, team }) {
useLaraBugUser({ id: user.id, plan: user.plan })
useLaraBugContext({ team_id: team.id })
useLaraBugTag('surface', 'dashboard')
return
}
```
They attach to everything reported from that point, so an error three components down still arrives knowing whose team it happened in.
---
Source: https://v4.larabug.com/docs/javascript/vue-3.md
# Vue 3
`@larabug/vue` is the browser client plus a plugin and four composables.
## Install the plugin
```js resources/js/app.js
import { createApp } from 'vue'
import { LaraBugVuePlugin } from '@larabug/vue'
import App from './App.vue'
const app = createApp(App)
app.use(LaraBugVuePlugin, {
dsn: import.meta.env.VITE_LARABUG_DSN,
environment: import.meta.env.MODE,
})
app.mount('#app')
```
The plugin hooks Vue's own error handler, so an error thrown in a component is reported with the component it came from rather than as a bare stack trace.
It takes every option [installation](/docs/javascript/installation) lists, plus three of its own:
| Option | What it does |
| --- | --- |
| `attachProps` | Attach the failing component's props to the report. |
| `trackLifecycleHooks` | Record lifecycle hooks as breadcrumbs. |
| `logErrors` | Keep logging errors to the console as well as reporting them. |
`attachProps` is useful and worth a thought: props are your data, and a component holding a signed in user holds their details.
## The composables
```vue
```
## With Inertia
Install `@larabug/inertia` as well and follow [Inertia](/docs/javascript/inertia). The Vue plugin stays where it is; the Inertia one adds what it knows about visits.
---
Source: https://v4.larabug.com/docs/javascript/inertia.md
# Inertia
`@larabug/inertia` sits alongside `@larabug/vue` or `@larabug/react` and adds what Inertia knows: which page you were on, which visit failed, and the Laravel context behind it.
## Install the plugin
```js resources/js/app.js
import { createInertiaApp } from '@inertiajs/vue3'
import { createInertiaLaraBugPlugin } from '@larabug/inertia'
import { LaraBugVuePlugin } from '@larabug/vue'
import { createApp, h } from 'vue'
createInertiaApp({
resolve: name => resolvePageComponent(name),
setup ({ el, App, props, plugin }) {
createApp({ render: () => h(App, props) })
.use(plugin)
.use(LaraBugVuePlugin, { dsn: import.meta.env.VITE_LARABUG_DSN })
.use(createInertiaLaraBugPlugin({
trackPageVisits: true,
trackErrors: true,
}))
.mount(el)
},
})
```
| Option | Default | What it does |
| --- | --- | --- |
| `trackPageVisits` | see the package | Record each visit as a breadcrumb, so a report says how the reader got there. |
| `trackErrors` | see the package | Report Inertia's own errors. |
| `trackNavigations` | see the package | Record navigation events. |
| `includeRequestData` | `false` | Attach `page.props` to reports. |
## Leave includeRequestData alone
It is off on purpose. Inertia page props routinely carry the authenticated user, CSRF tokens and flashed session data, and attaching them to every error means storing all of that with every error.
When you do want something from them, take the piece you want rather than the lot:
```js
import { setUserFromInertia, attachLaravelContext } from '@larabug/inertia'
setUserFromInertia(page.props.auth.user)
attachLaravelContext(page.props)
```
Turning `includeRequestData` on does run the props through the data filter first, but the filter is a safety net, not a plan.
---
Source: https://v4.larabug.com/docs/javascript/source-maps.md
# Source maps
A minified stack trace says `a.b is not a function` at `app-D4wpJuT4.js:1:48213`. Source maps turn that back into your file, your line, your function and the code around it.
Your build uploads its maps to LaraBug, tagged with a release. The SDK sends the same release with every error. LaraBug maps each frame with the maps of that release, so the maps never have to be public.
## Vite
Install the plugin:
```bash
npm install --save-dev @larabug/vite
```
Add it to `vite.config.js`, next to `laravel-vite-plugin` in a Laravel app:
```js vite.config.js
import { defineConfig } from 'vite'
import laravel from 'laravel-vite-plugin'
import larabug from '@larabug/vite'
export default defineConfig({
plugins: [
laravel({ input: ['resources/js/app.js'] }),
larabug(),
],
})
```
Give the build your application's ingest key, or its DSN, from the application settings:
```bash .env
LARABUG_KEY=lbi_your_ingest_key
```
On `vite build` the plugin:
1. Picks a release: `LARABUG_RELEASE` when set, otherwise the commit being built.
2. Writes hidden source maps, so the scripts carry no `sourceMappingURL` comment.
3. Puts the release in your bundle, where `@larabug/browser` picks it up for every error.
4. Uploads every map with the url of its script, then deletes the maps from the output.
`vite dev` is left alone. A failed upload never fails the build unless you pass `failOnError: true`.
## Webpack and Laravel Mix
Two things have to line up: the bundle has to carry the release, and the maps have to be uploaded under that same release. `DefinePlugin` sets the release, and `hidden-source-map` writes the maps without pointing browsers at them:
```js webpack.config.js
const { execSync } = require('child_process')
const webpack = require('webpack')
const release = process.env.LARABUG_RELEASE || execSync('git rev-parse HEAD').toString().trim()
module.exports = {
mode: 'production',
devtool: 'hidden-source-map',
plugins: [new webpack.DefinePlugin({ __LARABUG_RELEASE__: JSON.stringify(release) })],
}
```
Laravel Mix takes the same settings through `webpackConfig`:
```js webpack.mix.js
const { execSync } = require('child_process')
const release = process.env.LARABUG_RELEASE || execSync('git rev-parse HEAD').toString().trim()
mix.js('resources/js/app.js', 'public/js')
.webpackConfig((webpack) => ({
devtool: 'hidden-source-map',
plugins: [new webpack.DefinePlugin({ __LARABUG_RELEASE__: JSON.stringify(release) })],
}))
```
Then upload after the build, with the same release, and remove the maps so they are not served:
```bash
npx @larabug/sourcemaps upload --release "$(git rev-parse HEAD)" --dir public/js --url-prefix "~/js" --remove-source-maps
```
The uploader reads the key from `LARABUG_KEY` the same way the Vite plugin does. `npx @larabug/sourcemaps list --release ` prints what LaraBug holds for a release.
## Matching files
Every map is uploaded with the url of the script it belongs to, and a frame uses the map whose url matches its file:
- A path starting with `~/`, such as `~/build/assets/app-D4wpJuT4.js`, matches that path on any host. One upload covers production, staging and every preview domain.
- A full url, such as `https://cdn.example.com/build/assets/app-D4wpJuT4.js`, matches that host only.
A query string on the script, such as a cache buster, is ignored.
## Naming the build yourself
Without a bundler plugin, set `release` when you start the client, and upload with the same string:
```js
init({
dsn: import.meta.env.VITE_LARABUG_DSN,
release: import.meta.env.VITE_APP_VERSION,
})
```
An error without a release cannot be matched to any map, and the issue page says so.
## On the issue page
A JavaScript error mapped to its source shows the original file, line and function of each frame, with the code around it when the build included `sourcesContent`, as Vite and webpack do by default. A toggle shows the minified frames the browser reported. Frames from scripts with no map, such as a third party widget, stay minified and are marked as such.
Issues group on the original line. An error that was already grouped before you uploaded maps stays in the issue it was in.
Maps uploaded after an error arrived still apply: the errors of that release are filled in once the upload lands.
## Limits and retention
- One map can be up to 50 MB, and one release can hold up to 1000 maps.
- LaraBug keeps the maps of your newest 10 releases, counted by when they were last uploaded. Errors keep their original frames after the maps are gone.
- Uploading the same file for the same release again replaces it.
The application settings list every release and its files under **Source maps**, where you can delete a file or a whole release.
## The upload API
The plugin and the uploader call two endpoints, which you can call from any tool:
```bash
curl -X POST https://www.larabug.com/api/sourcemaps \
-H "X-LaraBug-Ingest-Key: lbi_your_ingest_key" \
-F release=v1.4.0 \
-F minified_url="~/build/assets/app-D4wpJuT4.js" \
-F sourcemap=@public/build/assets/app-D4wpJuT4.js.map
```
It answers `201` for a new file, `200` for a replaced one, `413` for a map over the size limit, `422` for a file that is not a version 3 source map, and `401` or `403` for credentials it does not accept. `GET /api/sourcemaps/releases/{release}` lists the files a release has.
---
Source: https://v4.larabug.com/docs/guides/filtering-sensitive-data.md
# Filtering sensitive data
An error report is a snapshot of a moment in your application, and moments in applications contain passwords, tokens and people. Both clients filter before anything is sent, and both let you add to what they filter.
You are the data controller for whatever your application chooses to send. LaraBug processes it on your behalf. The [Data Processing Agreement](/dpa) sets out what that means in practice.
## What is scrubbed already
Both clients ship a blacklist of field names matched against request parameters and object keys: `password`, `token`, `secret`, `auth`, `cookie` and their obvious relatives. A match is replaced, not removed, so you can still see that the field was there.
The JavaScript client also strips a list of query parameters out of URLs, `token` and `access_token` and `api_key` among them, because a URL ends up in a breadcrumb and a breadcrumb ends up in a report.
## Adding your own
Laravel, in `config/larabug.php`:
```php config/larabug.php
'blacklist' => [
'password',
'password_confirmation',
'iban',
'national_insurance_number',
],
```
JavaScript, at `init`:
```js
init({
dsn: import.meta.env.VITE_LARABUG_DSN,
blacklist: ['iban', 'national_insurance_number'],
urlBlacklist: ['invite_code'],
})
```
Both lists are merged with the defaults rather than replacing them, and both match case insensitively on a substring, so `iban` also covers `customer_iban`.
## The user block
The most personal thing in a report is usually the user, and by default the Laravel client sends the whole model. One method fixes it:
```php app/Models/User.php
use LaraBug\Concerns\Larabugable;
class User extends Authenticatable implements Larabugable
{
public function toLarabug(): array
{
return ['id' => $this->id];
}
}
```
In the browser, pass a `user` you have chosen rather than one you have to hand.
## The last word
The JavaScript client gives you the event itself before it goes:
```js
init({
dsn: import.meta.env.VITE_LARABUG_DSN,
beforeSend: (event) => {
if (event.request?.url?.includes('/admin')) {
return null
}
return event
},
})
```
Return `null` and nothing is sent. Return the event, changed however you like, and that is what arrives.
## What you cannot filter
Your own context. Anything you pass to `LaraBug::handle($e, 'php', [...])` or `captureException(error, {...})` is sent as given: the blacklist covers the fields the client collected, not the ones you added. Put an order id in there, not an address.
---
Source: https://v4.larabug.com/docs/guides/alerts-and-notifications.md
# Alerts and notifications
A tracker nobody reads is a log file with a nicer font. Notifications are set per application, under its settings.
## Where alerts can go
* **Email**, to the people on the application.
* **Slack**, **Discord** and **Microsoft Teams**, through an incoming webhook from the workspace or server you want the message in.
* **A webhook of your own**, posted as JSON, for a pager or a bot.
* **The mobile apps**, as a push the moment an issue is new.
## What is worth being told about
A new issue is the one that matters: something is happening that was not happening before. An occurrence of an issue you have already seen is usually not, and a busy application will teach you to ignore the channel if it sends one of those every minute.
## Turning it down
Two controls, and they answer different questions.
**Mute an application** when the noise is expected and temporary: a migration, a known outage, a load test. It is a maintenance window, and it turns itself back on.
**Snooze an issue** when you have seen it, you are not fixing it today, and you would like it to stop telling you. It comes back when the snooze ends, or when it happens again after a quiet period, so it cannot be forgotten by accident.
## Quieting the source instead
If something reports far more often than it is worth hearing about, the fix is usually in the client rather than in the notification settings: `except` for an exception class that is never interesting, `sleep` for one that is interesting once an hour rather than once a second, and `sample_rate` for queue jobs. See [capturing exceptions](/docs/issues/exceptions).
---
Source: https://v4.larabug.com/docs/integrations/mcp-server.md
# MCP server
LaraBug speaks MCP, so an assistant that supports it can read your issues while you are working on them. Ask what is failing, and it can list the issues, open one, read the latest occurrence with its stack trace and request, and hand it back.
## Connecting
The endpoint is streamable HTTP:
```
https://www.larabug.com/mcp
```
Point your client at it and complete the OAuth flow it offers. Claude Code, for example:
```bash
claude mcp add --transport http larabug https://www.larabug.com/mcp
```
Then run `/mcp` in Claude Code, pick LaraBug, and authenticate. That opens the OAuth flow in your browser, you approve the scopes, and the connection is remembered.
The connection is scoped to your account and sees exactly the applications you see.
## What it can read
| Tool | What it answers |
| --- | --- |
| `list_projects` | Which applications you have. |
| `get_project_summary` | How one of them is doing. |
| `list_issues` | What is open, filtered the way the panel filters. |
| `get_issue` | One issue, with its status and history. |
| `get_latest_occurrence` | The last time it happened, with the stack trace and the request. |
| `list_vulnerabilities` | The CVE findings for an application. |
## What it can change
| Tool | What it does |
| --- | --- |
| `update_issue_status` | Mark an issue read, fixed or open. |
| `add_issue_comment` | Leave a comment on the thread. |
| `assign_issue` | Assign it to somebody on the application. |
| `set_issue_priority` | Set the priority. |
| `snooze_issue` | Snooze it, with a reason. |
Reading needs the read scope, and the five above need the write scope. Nothing here deletes anything, and nothing reaches your application: the server reads the reports LaraBug already holds.
## Using it well
The thing it is good at is the loop where you are fixing something. Paste a failing test, ask for the issue behind it, and let the assistant read the occurrence rather than describing it to it: the stack trace, the request, the twelve lines of code around the failure and the user it happened to are all already stored.
---
Source: https://v4.larabug.com/docs/integrations/http-api.md
# HTTP API
Two different things live under `/api`, and it is worth knowing which one you want.
## Reporting an event
```
POST https://www.larabug.com/api/log
```
This is the endpoint the clients post to, and the one a client for a language we do not ship would target. It authenticates with the application's ingest key and project key, or with the DSN that carries both, and it reaches nothing else in your account.
An older pairing, an account token plus the project key, still works for the clients deployed before the ingest key existed. It answers with a `Deprecation` header and will not be there forever.
Unless you are writing a client, use a client: the Laravel and JavaScript packages do the filtering, the batching, the deduplication and the retries, and those are most of the work.
## Reading your account
The rest of the API reads what LaraBug has stored: your applications, their exceptions, their queue jobs and queries. It authenticates with your account token, which is a different credential from the one above and is your whole account rather than one application.
`POST /api/login` with your email and password returns it, which is how the mobile app signs in.
Send it as a bearer token:
```bash
curl https://www.larabug.com/api/projects \
-H "Authorization: Bearer YOUR_ACCOUNT_TOKEN" \
-H "Accept: application/json"
```
| Endpoint | What it returns |
| --- | --- |
| `GET /api/user` | The account the token belongs to. |
| `GET /api/projects` | Your applications. |
| `POST /api/projects` | A new application. |
| `GET /api/projects/{project}` | One application. |
| `GET /api/projects/{project}/exceptions` | Its exceptions. |
| `GET /api/projects/{project}/exceptions/{exception}` | One of its exceptions. |
| `GET /api/projects/{project}/queue-jobs` | Its queue jobs. |
| `GET /api/projects/{project}/queries` | Its queries. |
| `GET /api/projects/{project}/scheduled-tasks` | Its scheduled tasks. |
| `GET /api/projects/{project}/mail` | The mail it sent. |
| `GET /api/projects/{project}/notifications` | The notifications it sent. |
| `GET /api/projects/{project}/cache` | Its cache events. |
| `GET /api/projects/{project}/commands` | The commands it ran. |
| `GET /api/exceptions` | Exceptions across your applications. |
| `GET /api/exceptions/{exception}` | One exception. |
| `POST /api/exceptions/{exception}/read` | Mark it read. |
| `POST /api/exceptions/{exception}/toggle-public` | Turn its public page on or off. |
| `DELETE /api/exceptions/{exception}` | Delete it. |
Everything is JSON, everything is scoped to the account the token belongs to, and a token sees exactly what its owner sees.
The tokens under **Profile, API tokens** are a different credential. Those are for the [MCP server](/docs/integrations/mcp-server) and for apps you connect through OAuth, and they are not what this API reads.
## Asking the API what it offers
```
GET https://www.larabug.com/api
```
The root describes itself: every endpoint, what it returns, how to authenticate, what the rate limit is, and where the MCP server is. Nothing authenticates it, because the question it answers is how to authenticate.
## Or ask an assistant instead
If what you want is to read issues while you work rather than to build something, the [MCP server](/docs/integrations/mcp-server) is the same data without the plumbing.